Dashboard
You use this section to access all configurations, reports, and additional information pertinent to your messages.
After you log into the platform, you see the Dashboard section as the first screen. You return to the Dashboard at any time by selecting the Dashboard icon in the left Navigation sidebar.
You work with four sections in the dashboard:
NOTEOnly Environments with at least one assigned Workspace are included in the report count.
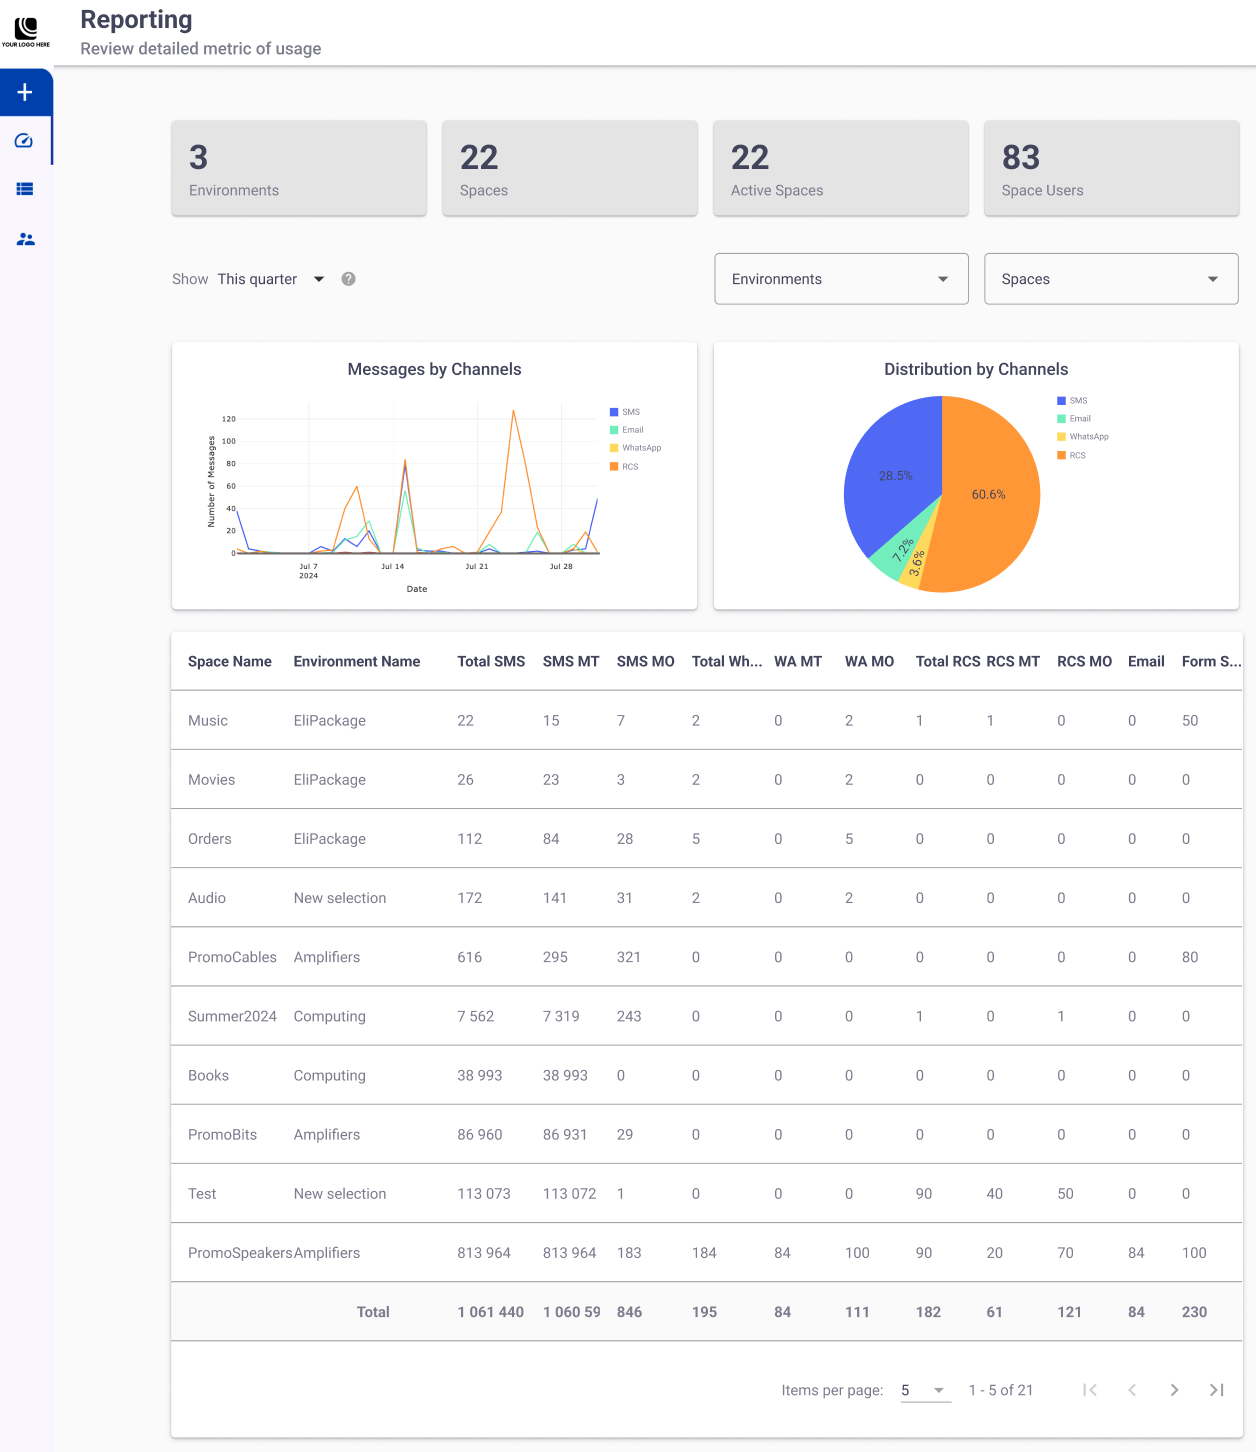
KPIs
At the top of the dashboard, you see four snapshots of key performance indicators (KPIs). These provide an overview of general information regarding Environments and Workspaces.

- Environments: Total number of available Environments on the platform.
NOTE
Only Environments with at least one assigned Workspace are included in the report count.
- Workspaces: Total number of Workspaces on the platform, irrespective of the Environments.
- Active Workspaces: Total number of active Workspaces available on the platform, irrespective of the Environments.
- Workspace Users: Total number of active users who are members of at least one Workspace, regardless of the assigned role.
NOTEEach KPI's value is fixed, meaning they are not subject to filtering.
Filters
You apply three filters across the entire report, except for the KPIs:

Date Range Filter
You use the Date Range Filter to filter the displayed data to a selected date range. You see only data generated within the selected range.
Selecting it yields several predefined date range options and a two-month calendar, as shown in the following figure.
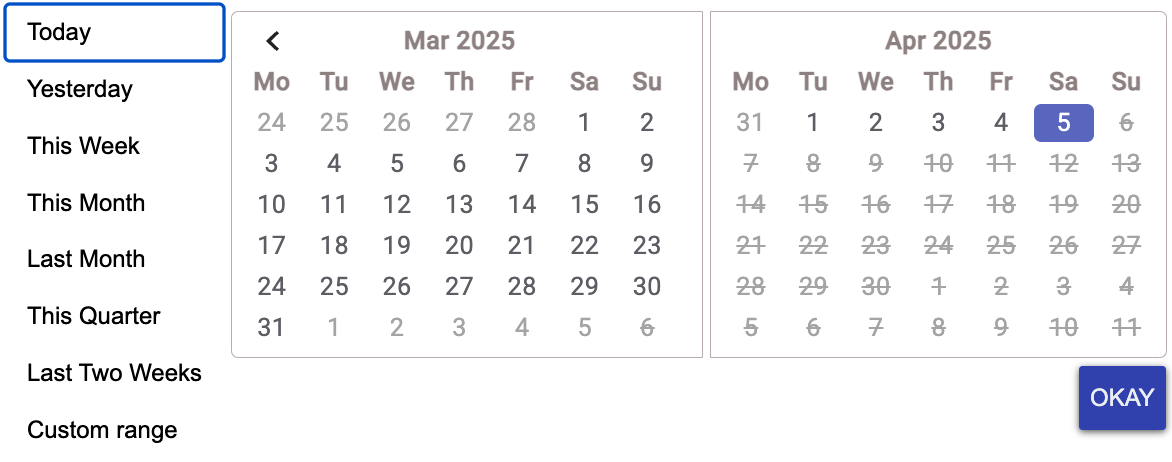
You narrow down the data displayed in any section of the UI (except KPIs) by selecting one of the seven predefined options. To use a custom range, you choose the start and end dates from the calendar and select OKAY. You see only the information generated within the selected date range.
Environment & Workspace Filter
Each Environment contains a limited number of Workspaces. You filter by Environment, by Workspace, or by both. For instance, if you choose a single Environment from the Environments dropdown and select View All from the Workspaces dropdown, you see data for all Workspaces in that Environment.

By default, both filters are set to View All. You see data for all Environments and Workspaces available on the platform.
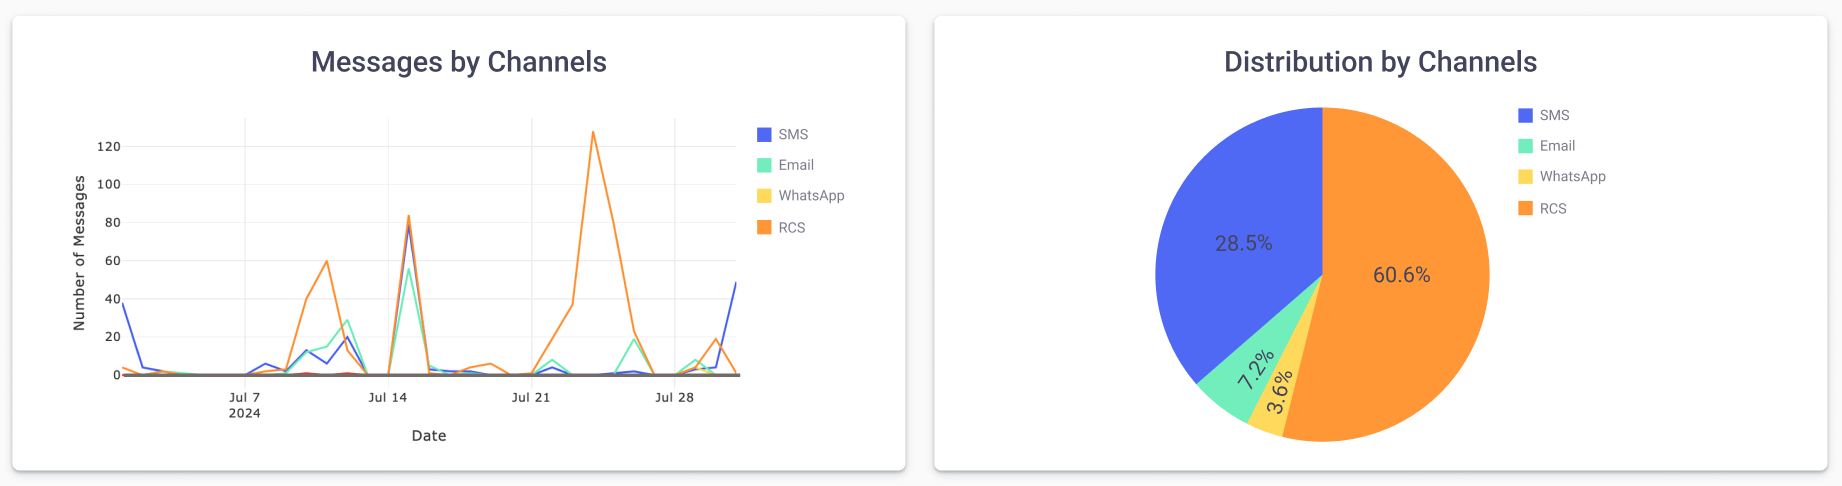
Data Graph Display
You see two Data Visualization Graphs beneath the filters:
-
Messages by Channels: You see the total number of outgoing (MT) and incoming (MO) messages by delivery channel, displayed on a timeline.
Each channel is identified by a color code legend shown in the top right corner of the graph.
-
Distribution by Channels: You see the percentage of messages sent across different delivery channels (SMS, Email, WhatsApp, RCS) between Workspaces.
You use this graph to understand how messages are distributed across delivery channels. Each channel is identified by a color code legend shown in the top right corner of the graph.
Messaging Information
You see in this table the total quantity of outgoing (MT) and incoming (MO) messages by channel, Workspace, and Environment.
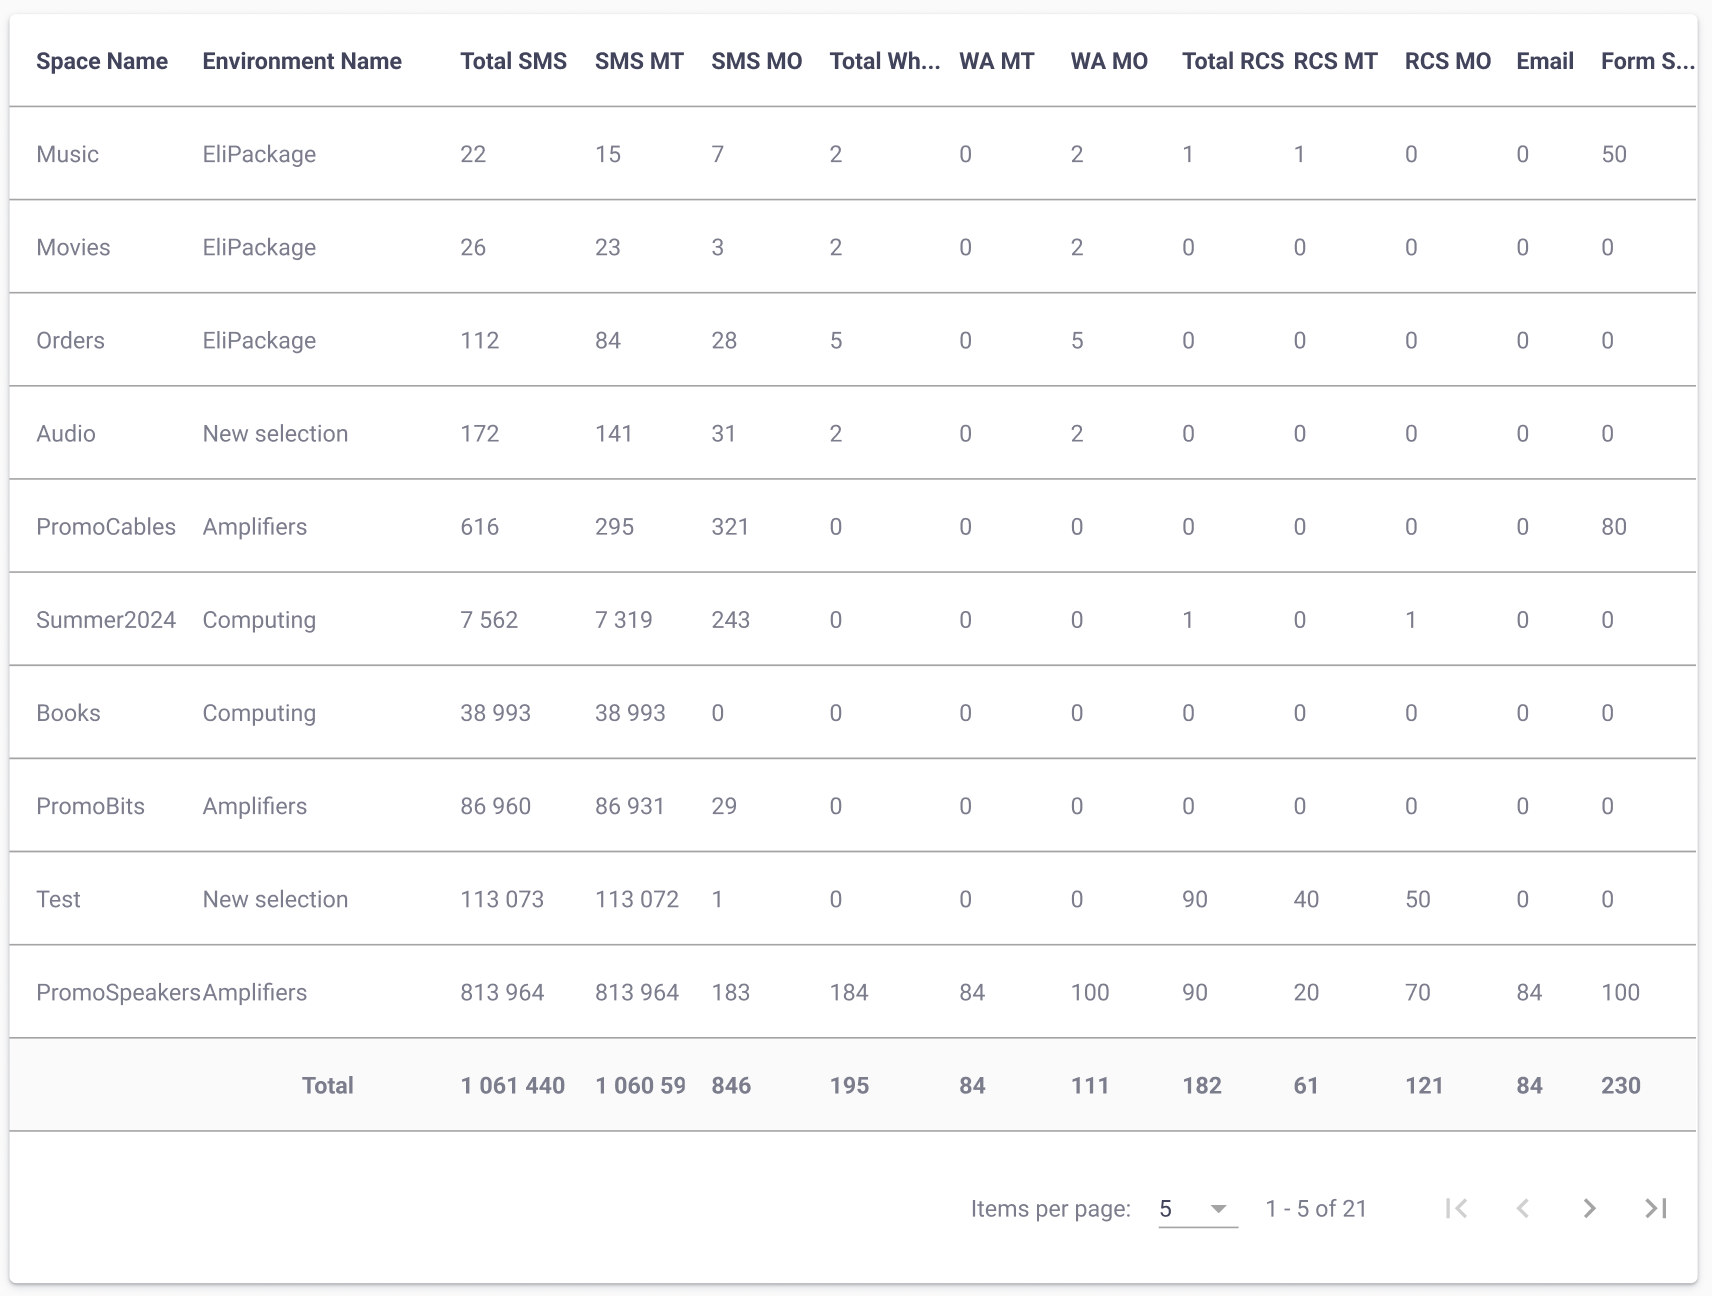
You see the following columns in the table:
| Column Name | Description |
|---|---|
| Space Name | Name of the Workspace. |
| Environment Name | Name of the Environment to which the Workspace belongs. |
| Total SMS | Total number of SMS messages outgoing and incoming. |
| SMS MT | Total number of SMS messages outgoing. |
| SMS MO | Total number of SMS messages incoming. |
| Total Whatsapp | Total number of WhatsApp messages, outgoing and incoming. |
| WA MT | Total number of outgoing WhatsApp messages. |
| WA MO | Total number of incoming WhatsApp messages. |
| Total RCS | Total number of RCS messages outgoing and incoming. |
| RCS MT | Total number of RCS messages outgoing. |
| RCS MO | Total number of RCS messages incoming. |
| Total number of email addresses sent. | |
| Form Submission | Total number of subscription forms generated. |
Updated 23 days ago