Dashboard
After you log into Communications Platform, you see the Dashboard as the first screen. You access and monitor key metrics from here, including those related to your broadcasts, automations, message templates, and contacts.
You navigate to all other platform sections from here. You return to this view at any time by selecting the Dashboard icon in the left Navigation sidebar.
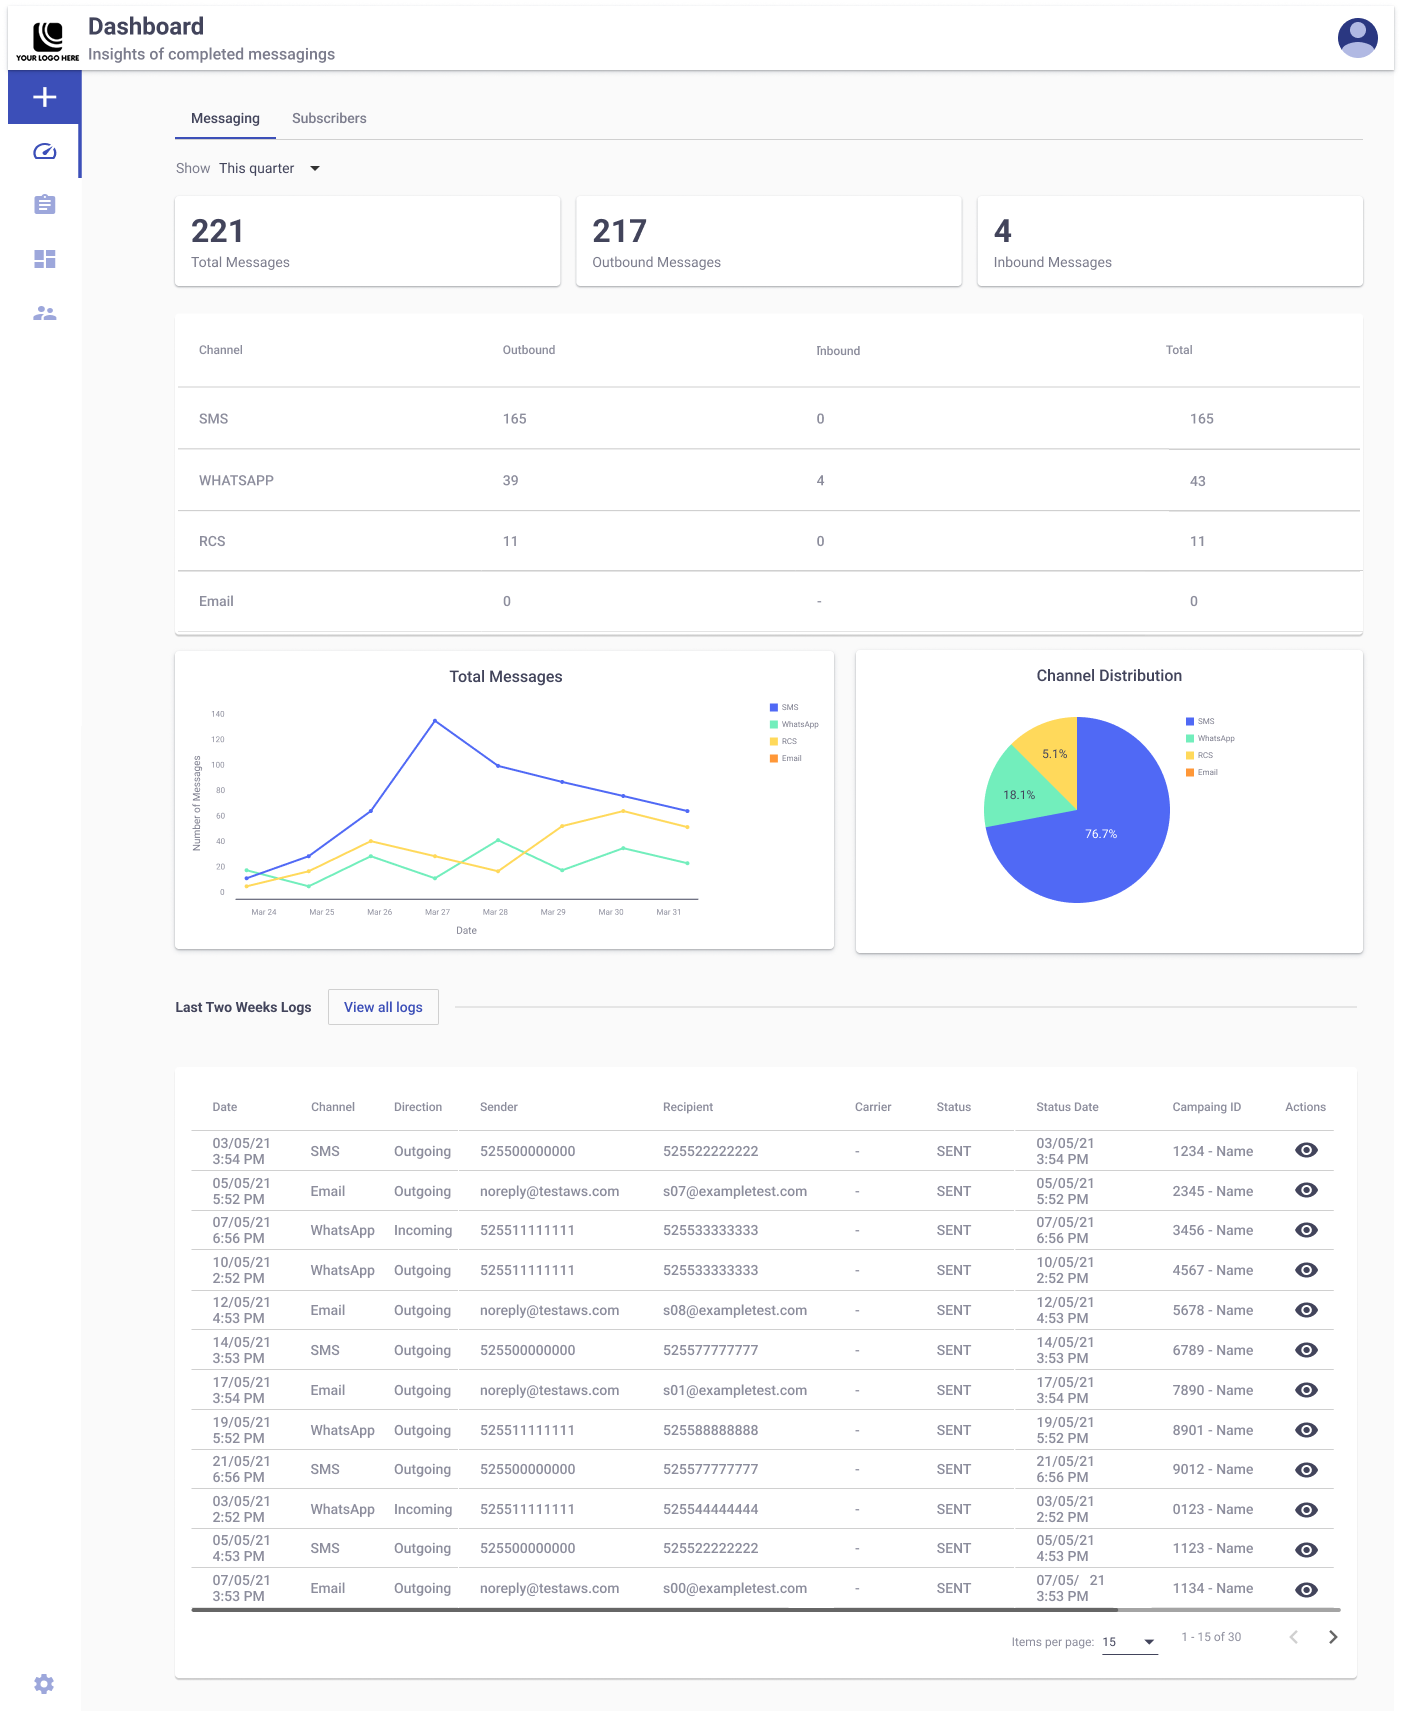
You work with two main areas in the Dashboard:
- Messaging tab — You see performance metrics and delivery analytics for your broadcasts and automations.
- Subscribers tab — You see contacts activity, growth, and engagement data.
Each tab focuses on a different aspect of the platform. You access performance insights for each area based on your selected time range.
Date Range Filter
You use the Date Range Filter, available in both tabs, to narrow your data by selecting a date range. You see only broadcast or contact data generated during the selected period.
You apply the filter using the following steps:
-
You select the Show dropdown at the top right of the tab.

-
You choose from the following predefined ranges:
- Today
- Yesterday
- This Week
- This Month
- Last Month
- This Quarter
- Last Two Weeks
- Custom range
For custom dates, you select the start and end dates from the calendar and select OKAY.
The platform refreshes the displayed data based on your selected timeframe.

NOTEThere is an extra option called "All". This option will display every record from the beginning of time to the current date and it is only available when filtering by Broadcasts or Automations from the Performance Analytics & Reporting section.
When selecting the "This Week" option, the date range filter could consider Sunday as the first day of the week, depending on the browser's timezone.
Updated 11 days ago