Contacts Analytics
You see how many contacts have been added to the platform Contacts List in the Subscribers tab Dashboard. The period shown is specified by the Date Range Filter.
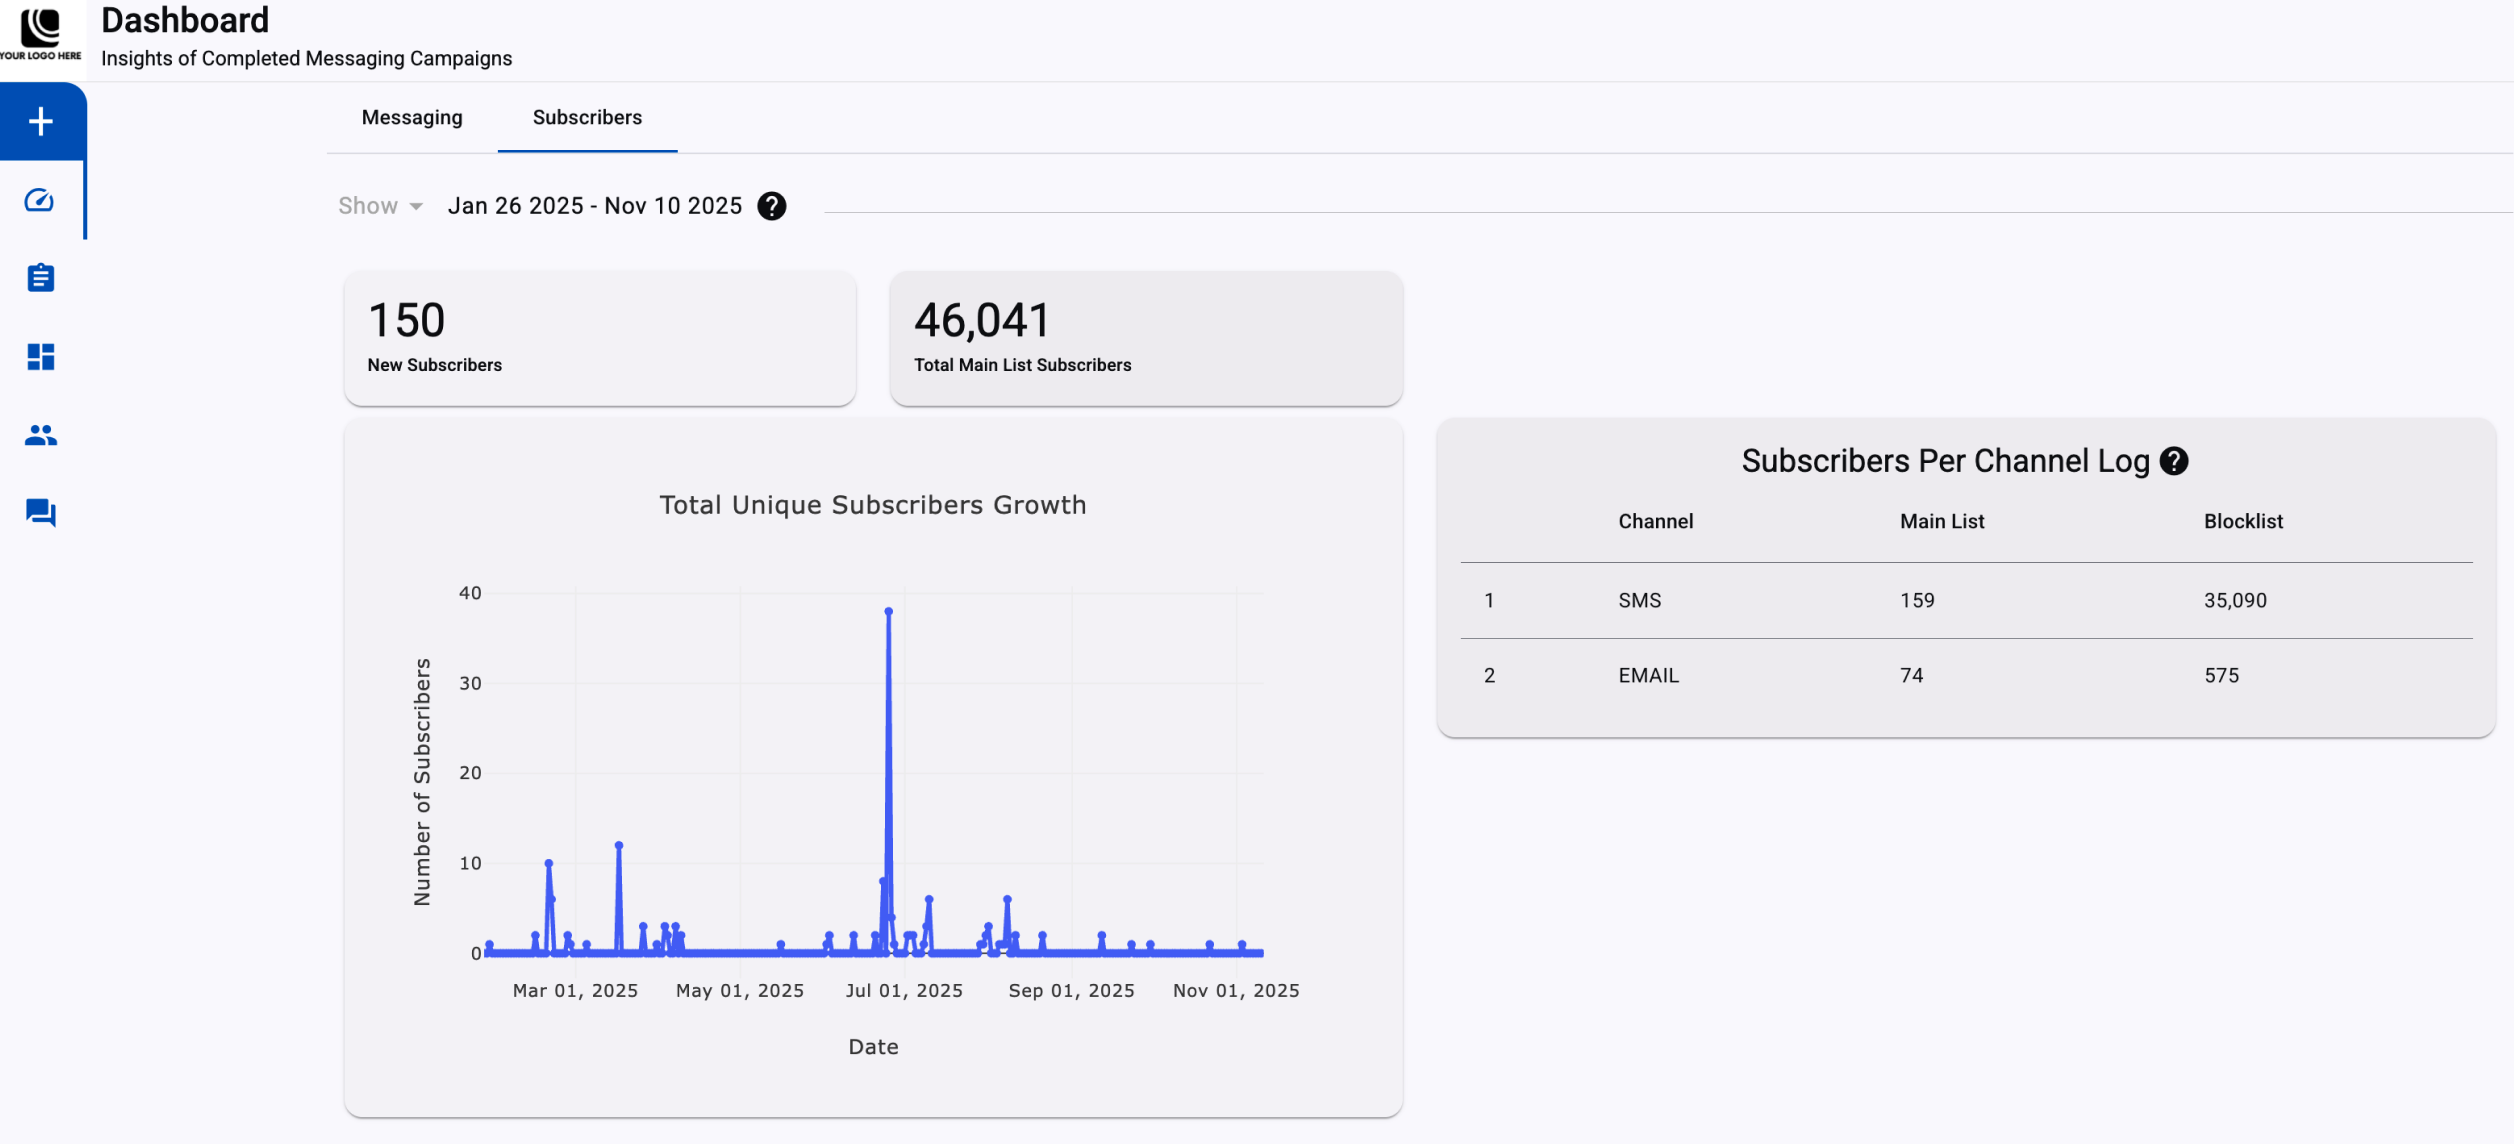
You see three sections in this tab:
- KPIs
- Contact Gains per Date
- Per Channel and Status distribution of Contacts
KPIs
You see two contact KPIs:
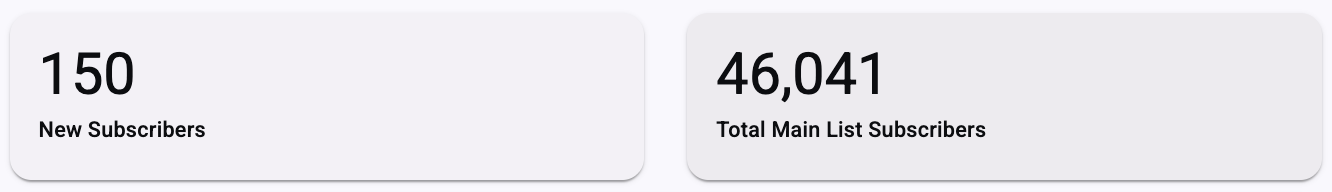
- New Subscribers — You see how many new contacts have been added over the period specified in the date range filter.
- Total Main List Subscribers — You see the overall number of contacts currently on the platform's Contacts list. This is a running total of the contacts. It cannot be filtered.
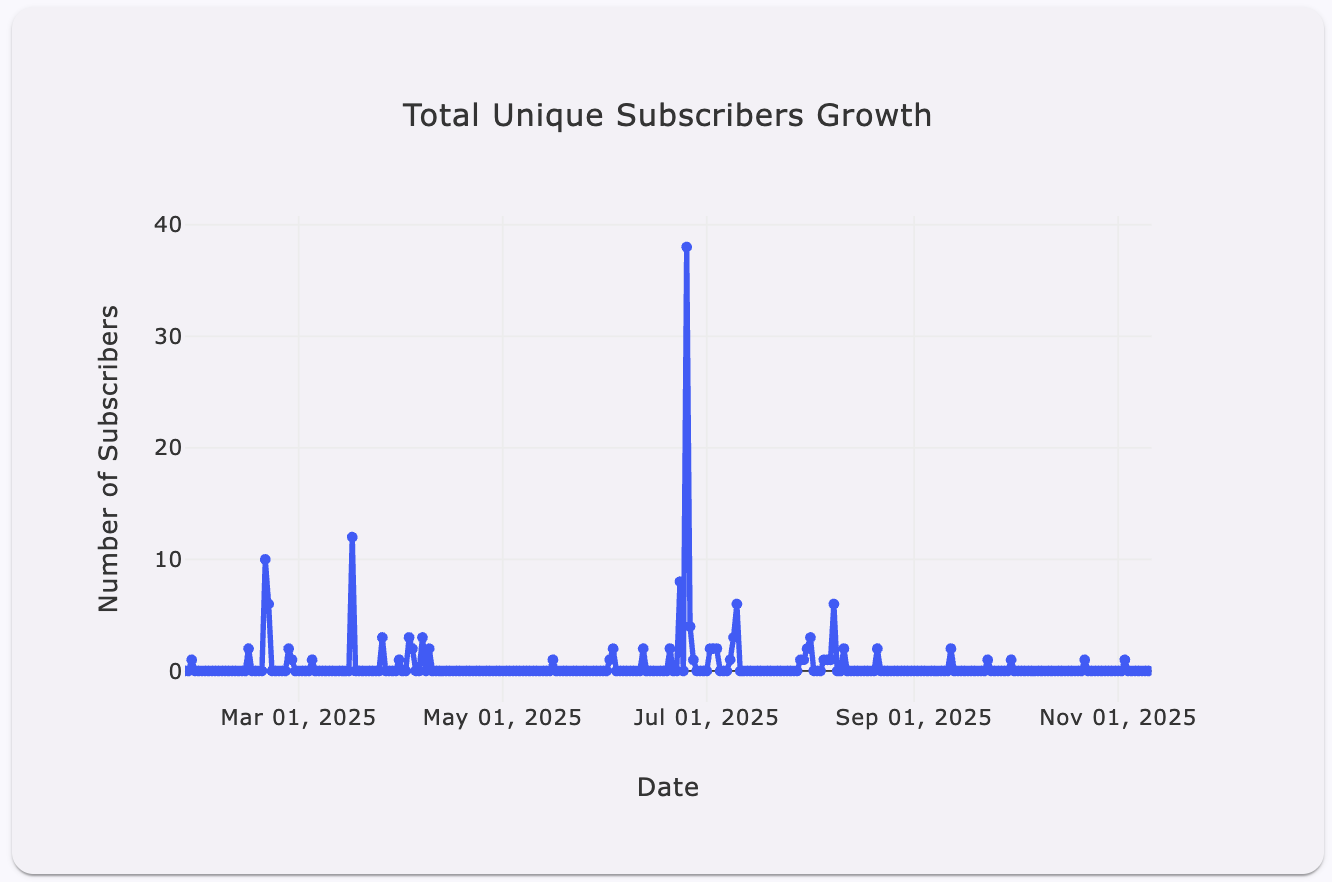
Data Visualization
You see the contact gains per date in the Total Unique Subscribers Growth graph. You view the number of contacts gained per date over the specified period.
Subscribers Per Channel Log
You see the distribution of contacts per channel in the Subscribers per Channel Log. The table breaks down contacts by Channel, SMS, or Email, and by standing.
You do not filter this table data, as it represents Contact running totals.
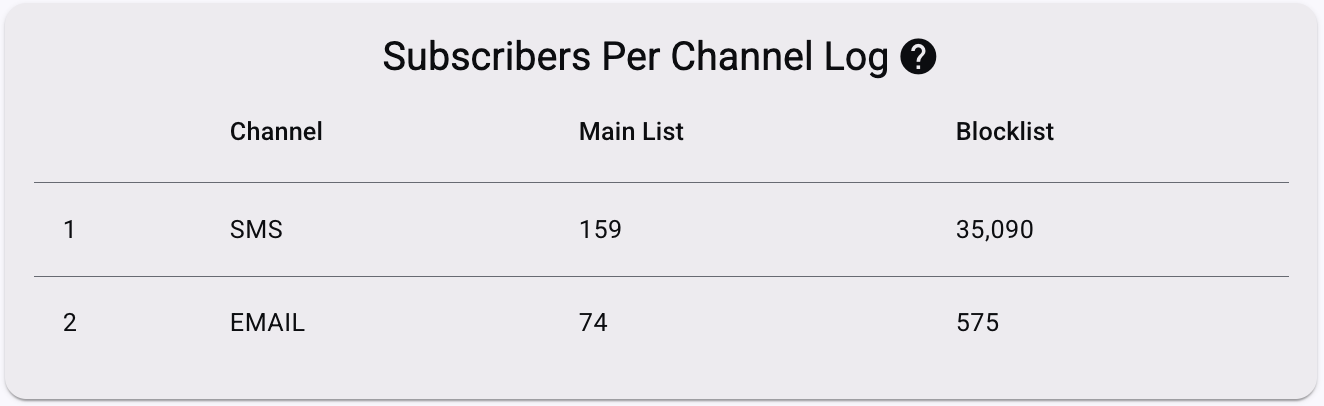
A contact is always part of the Main list, regardless of whether they are blocklisted. The blocklisted condition may be temporary. The platform reinstates blocklisted contacts when the condition is resolved.
The platform treats blocklist contacts as not eligible for message delivery. Blocklist contacts remain on the Main list. Contacts may be present in SMS, Email, or both, and are counted as one contact in the overall total.
Updated 6 days ago