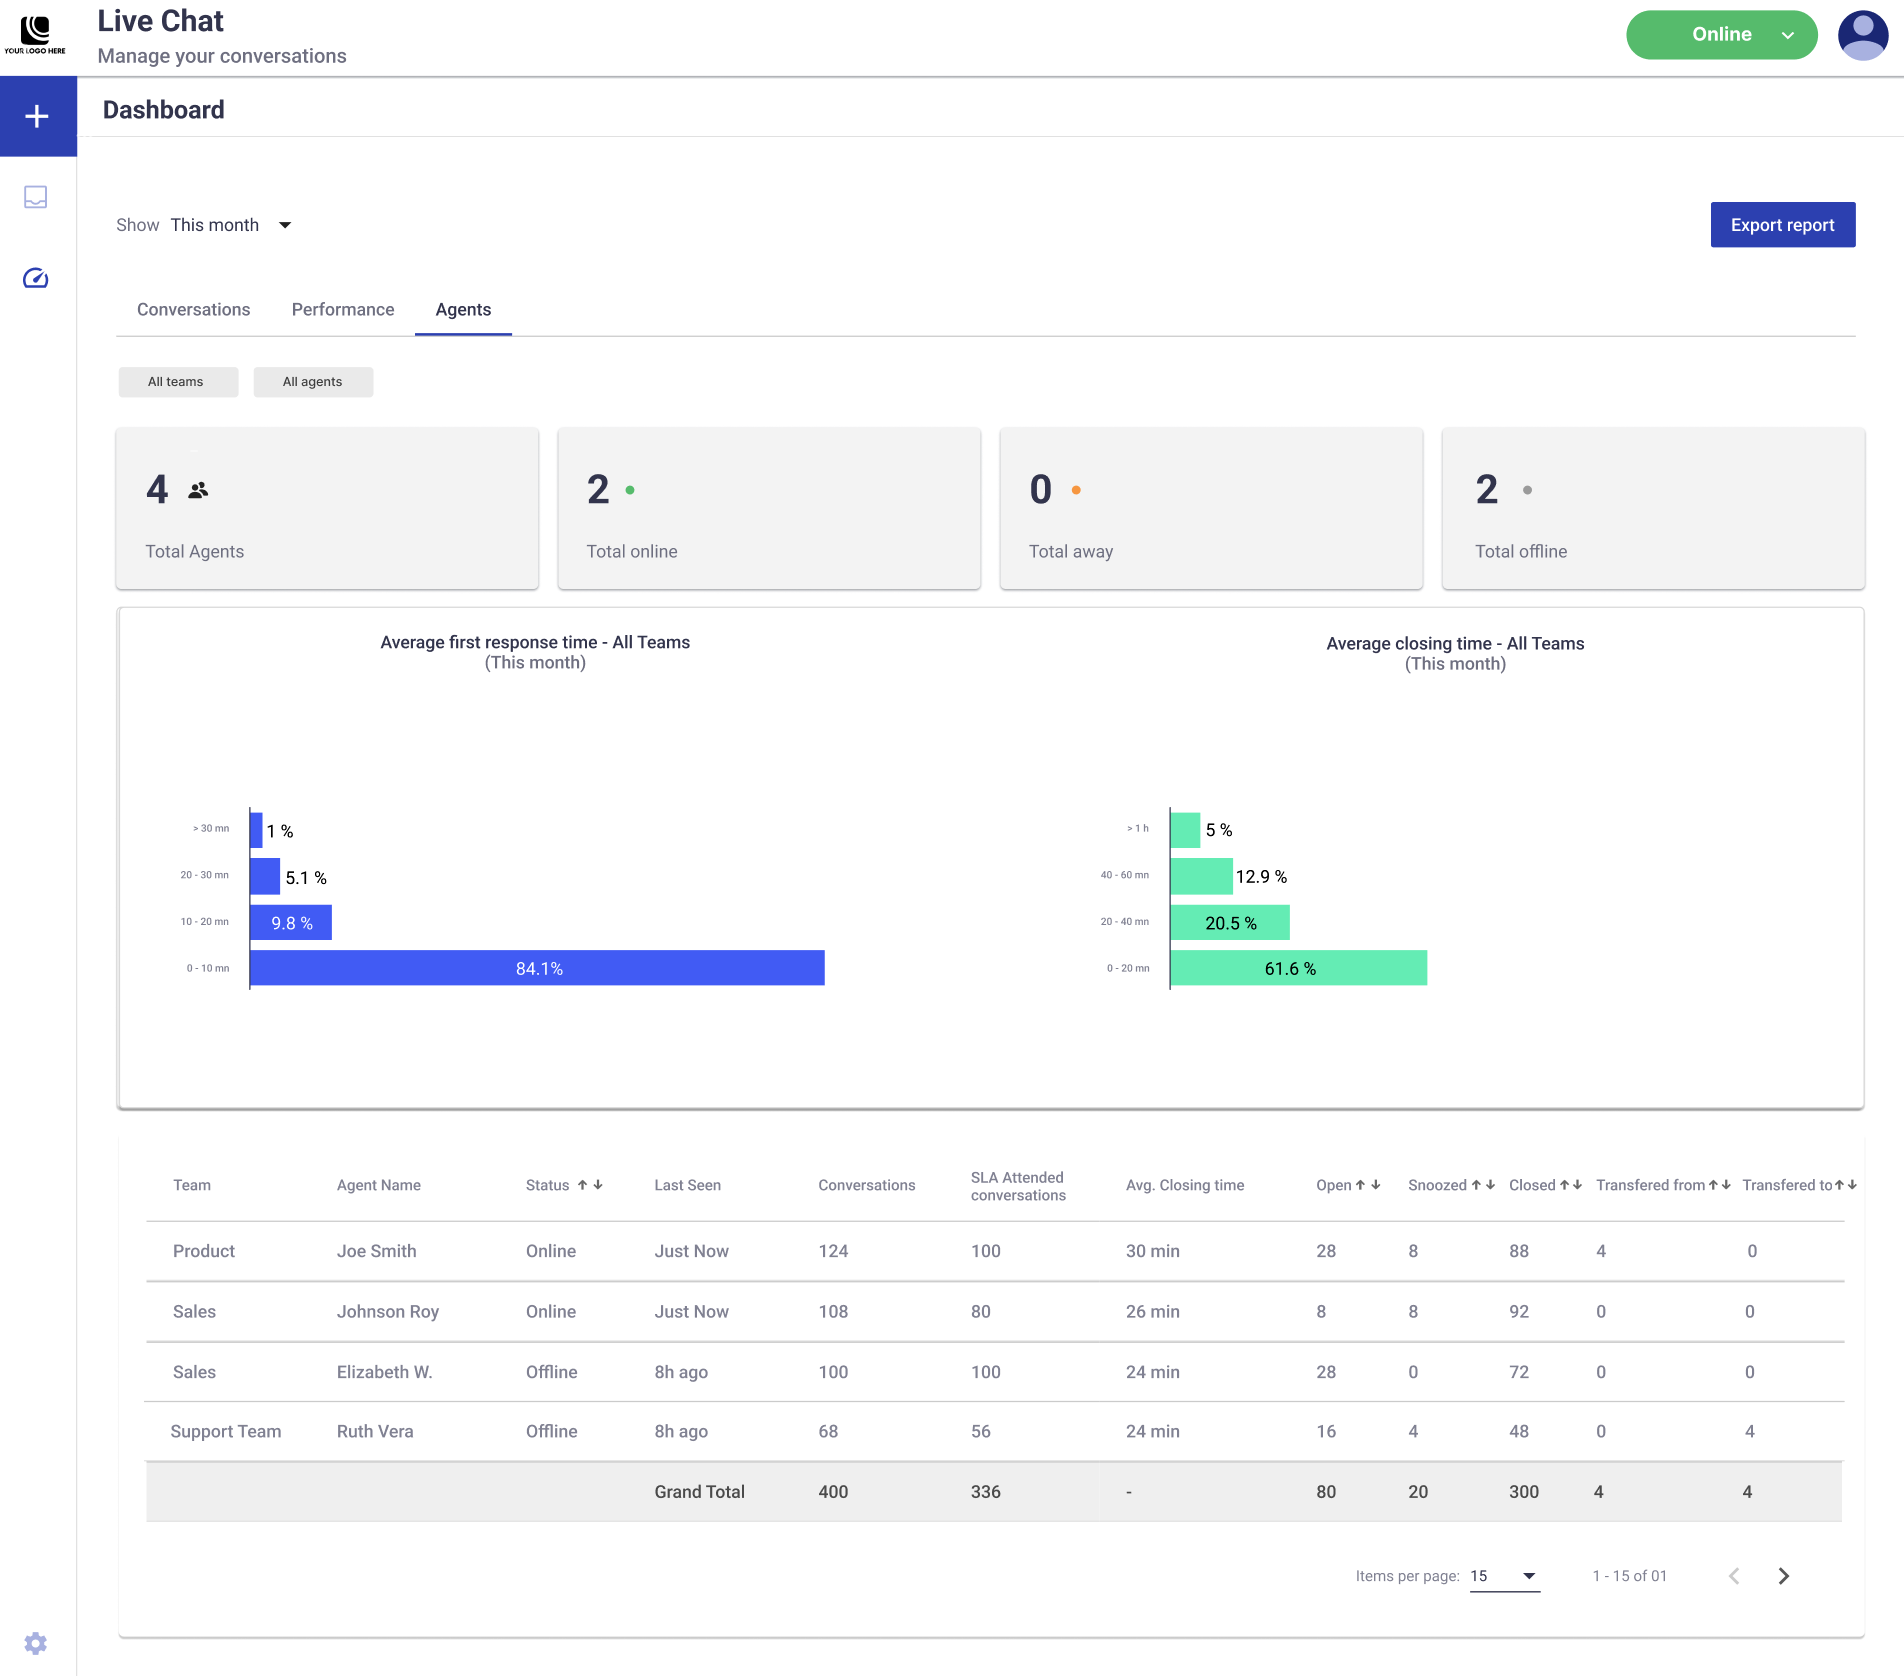
Agents dashboard
The Agents dashboard provides an overview of individual agent performance and status. It features KPIs, graphs, and tables to track agent activity and efficiency. Here’s a breakdown of each component:

Filters
- Date Range Filter:
- Located at the top of the dashboard.
- Allows filtering the displayed data by a specific date range. Changes apply across all three tabs (Conversations, Performance, Agents).
- Team Filter:
- Located at the top-left corner of the tab.
- Allows viewing data for all teams and agents collectively or filtering by a specific team or agent.
KPIs (Top Metrics)
- Total Agents: The total number of agents assigned to handle live chat conversations. Provides a count of all agents across teams according to the selected time period.
- Total Online: The number of agents currently online and available to manage conversations.
- Total Away: The number of agents currently marked as “Away”. Highlights agents temporarily unavailable to handle conversations.
- Total Offline: The number of agents currently offline. Reflects the number of agents unavailable to handle conversations.
Graphs
- Average First Response Time: Displays the percentage distribution of first response times broken into intervals (e.g., 0–10 min, 10–20 min) according to the selected time period.
- Bars show the percentage average of conversations responded to within each time range.
- The largest percentage (e.g., 84.4% within 0–10 min) highlights where most responses occur.
- A higher percentage in intervals exceeding the configured SLA threshold suggests underperformance in team operations.
- You can filter by each agent to know their first response time performance.
- Average Closing Time: Visualizes the percentage distribution of closing times broken into intervals (e.g., 0–20 min, 20–40 min) according to the selected time period.
- Bars show the percentage average of conversations resolved and closed within each time range.
- A higher percentage in the lower time ranges (e.g., 37.1% within 0–20 min) indicates efficient resolution times.
- You can filter by each agent to know their average closing time performance.
Teams & Agents Performance table
The table at the bottom provides a detailed breakdown of conversation metrics per team and agent during the selected time period.
- Team: The name of the team managing the conversations (e.g., Product, Sales, Support).
- Agent Name: The name of the agent.
- Status: The current status of the agent (Online, Away, Offline).
- Last Seen: The last activity timestamp of the agent (e.g., “Just Now” or “8h ago”).
- Conversations: Total number of conversations handled by the agent during the selected time period.
- SLA Attended Conversations: The number of conversations the agent handled within the configured SLA threshold.
- Avg. Closing Time: The agent’s average time to close conversations.
- Open: Number of conversations still open and unresolved. Reflects the agent’s current workload.
- Snoozed: Number of conversations snoozed by the agent. Indicates pending follow-ups.
- Closed: Total number of conversations successfully resolved and closed by the agent. Shows the agent’s efficiency in addressing queries.
- Transferred To: Number of conversations that were transferred by the agent to another agent.
- Transferred From: Number of conversations received by the agent that were transferred from another agent.
Updated 7 months ago
