Polls & Surveys
The Polls and Surveys automation reporting provides a comprehensive view of how users interact with your interactive questionnaires. It breaks down each stage of user engagement and message delivery in a clear visual format.
The reporting includes four main tabs:
- KPIs: Displays the primary performance indicators according to the delivery channel chosen for the automation.
- Delivery: Shows delivery status per channel (SMS, WhatsApp, RCS) across recipients.
- Questions and Answers: Shows a detailed analysis of user responses, including engaged users, total questions answered, and a visual breakdown of answer choices.
- Campaign Overview: Summarizes the automation setup.
- Participants: Lists users who engaged with the automation, with individual activity, participation status, and re-engagement options.
KPIs
Three key metrics appear at the top of the analytics and reporting interface:

- Total Messages Sent: Total messages successfully sent through the delivery channel chosen for the automation.
- Delivery Rate - The percentage of messages that were successfully delivered.
- Transit Rate - Percentage of messages still in transit and pending final delivery status.
- Failed Rate - Percentage of messages that failed to be delivered.
These KPIs show how effectively the automation delivered messages and drove user engagement.
Delivery tab
The Delivery tab shows the Messages by Status chart for assessing the delivery flow.
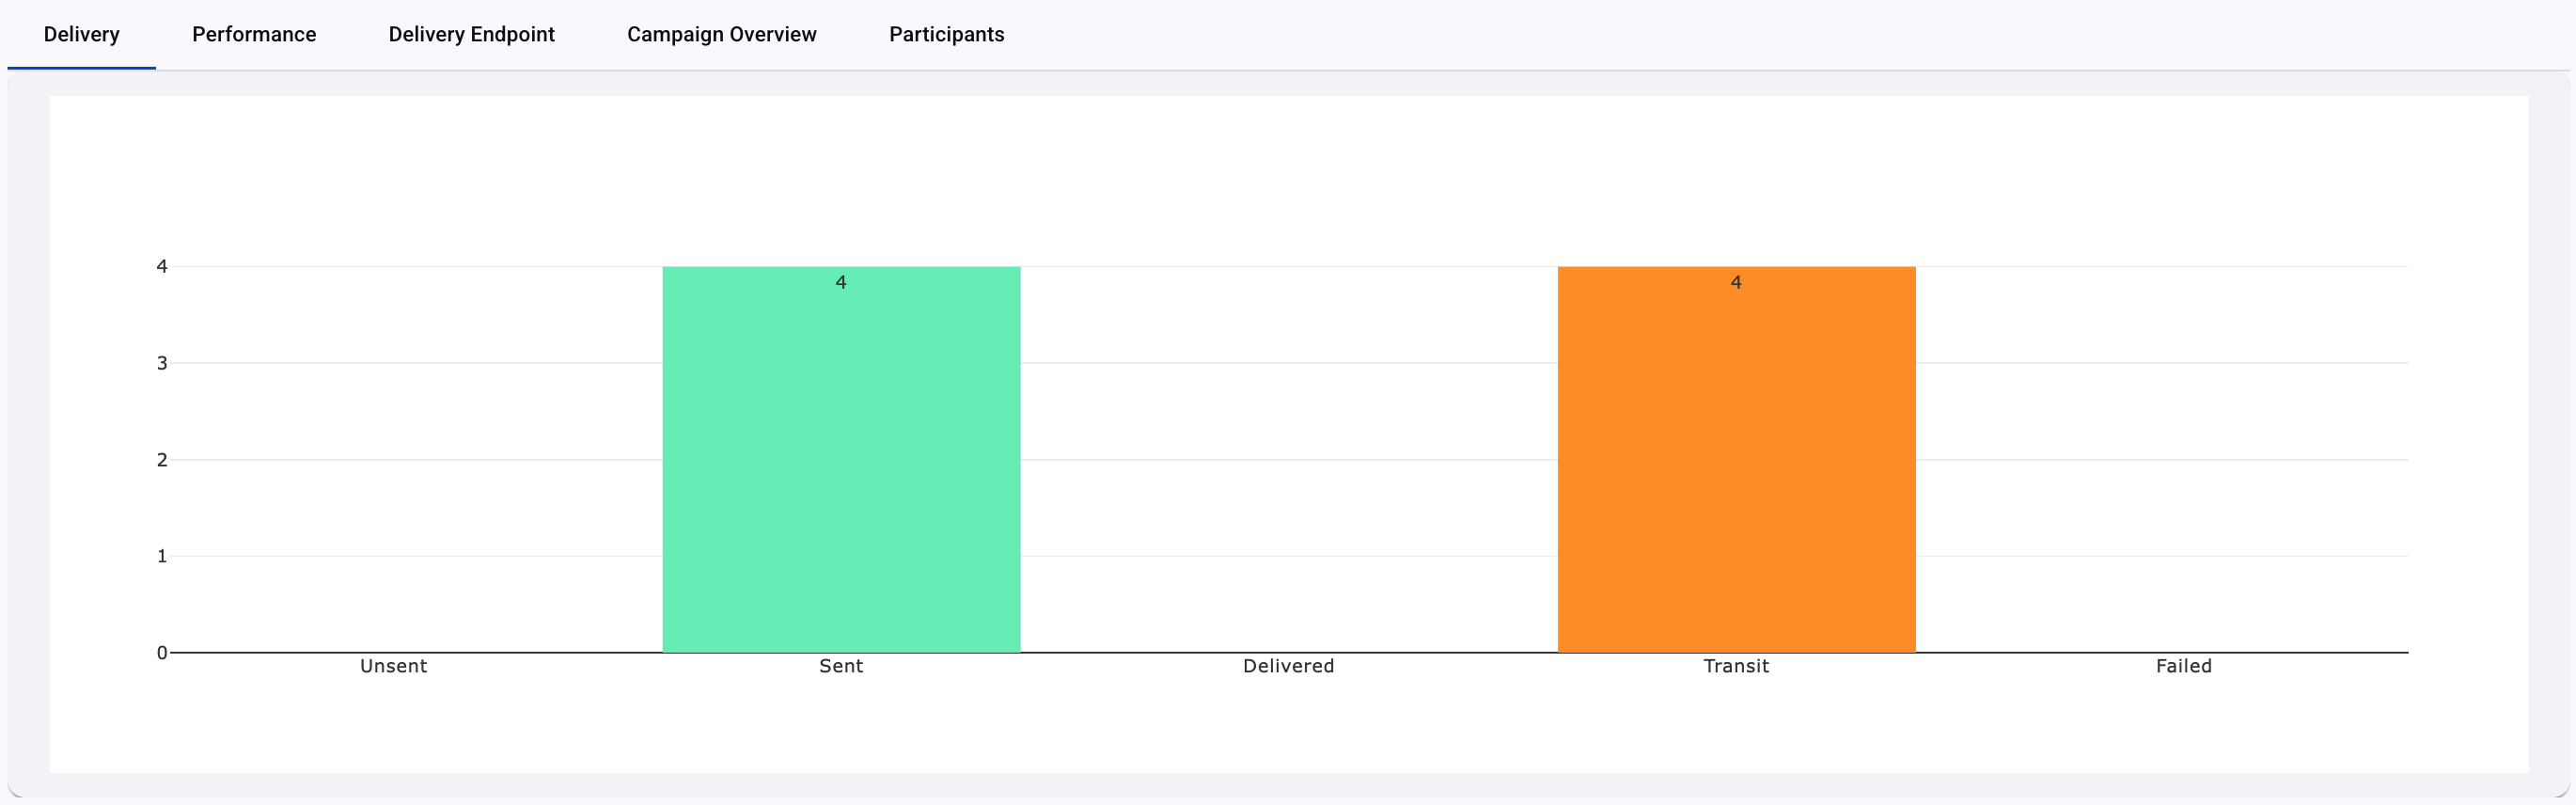
The chart dynamically adapts based on the channel used for delivery (SMS, WhatsApp, RCS). The specific documentation for each delivery channel covers the meaning and logic behind each status.
Questions & Answers tab
The Questions & Answers tab breaks down responses to each question in a graphical and tabular format, as shown below.

KPIs
The following KPIs appear at the top of the Questions & Answers tab.

- Engaged Users: Number of unique users who have interacted with the survey.
- Total Questions: Number of questions included in the automation.
- Total Interactions answered: Total responses recorded across all single-interaction answer options.
If you set up a Web Polls & Surveys automation, the KPIs will be the following:

- Engaged Users: Number of users who interacted with the poll or survey.
- Total Questions: Number of questions included in the automation.
- Total Interactions answered: Total number of responses received across all questions in the automation. Each answer selected by a user is counted here.
- Participation Rate: Percentage of users who received the automation and submitted at least one answer.
Answers Distribution Graph
The Answers Distribution graph visualizes how participants responded to a specific poll or survey question. Each colored horizontal bar represents one answer option. The bar length indicates the total responses for that option.
Each question appears at the top of the graph. Its options are listed between the table and the graph.
- X-axis (horizontal): Shows the number of responses for each answer option.
- Y-axis (vertical): Represents each answer option from the question shown as horizontal bars in different colors.
Response Table (Right Panel)
The table provides an exact numeric and percentage breakdown of each answer option. The table consists of the following columns:
- Answer Choices: The label or text of the option that users can select when answering the question.
- Total Answers: The total number of responses this answer received.
- Answer Rate: The percentage (%) of total participants who chose this option.
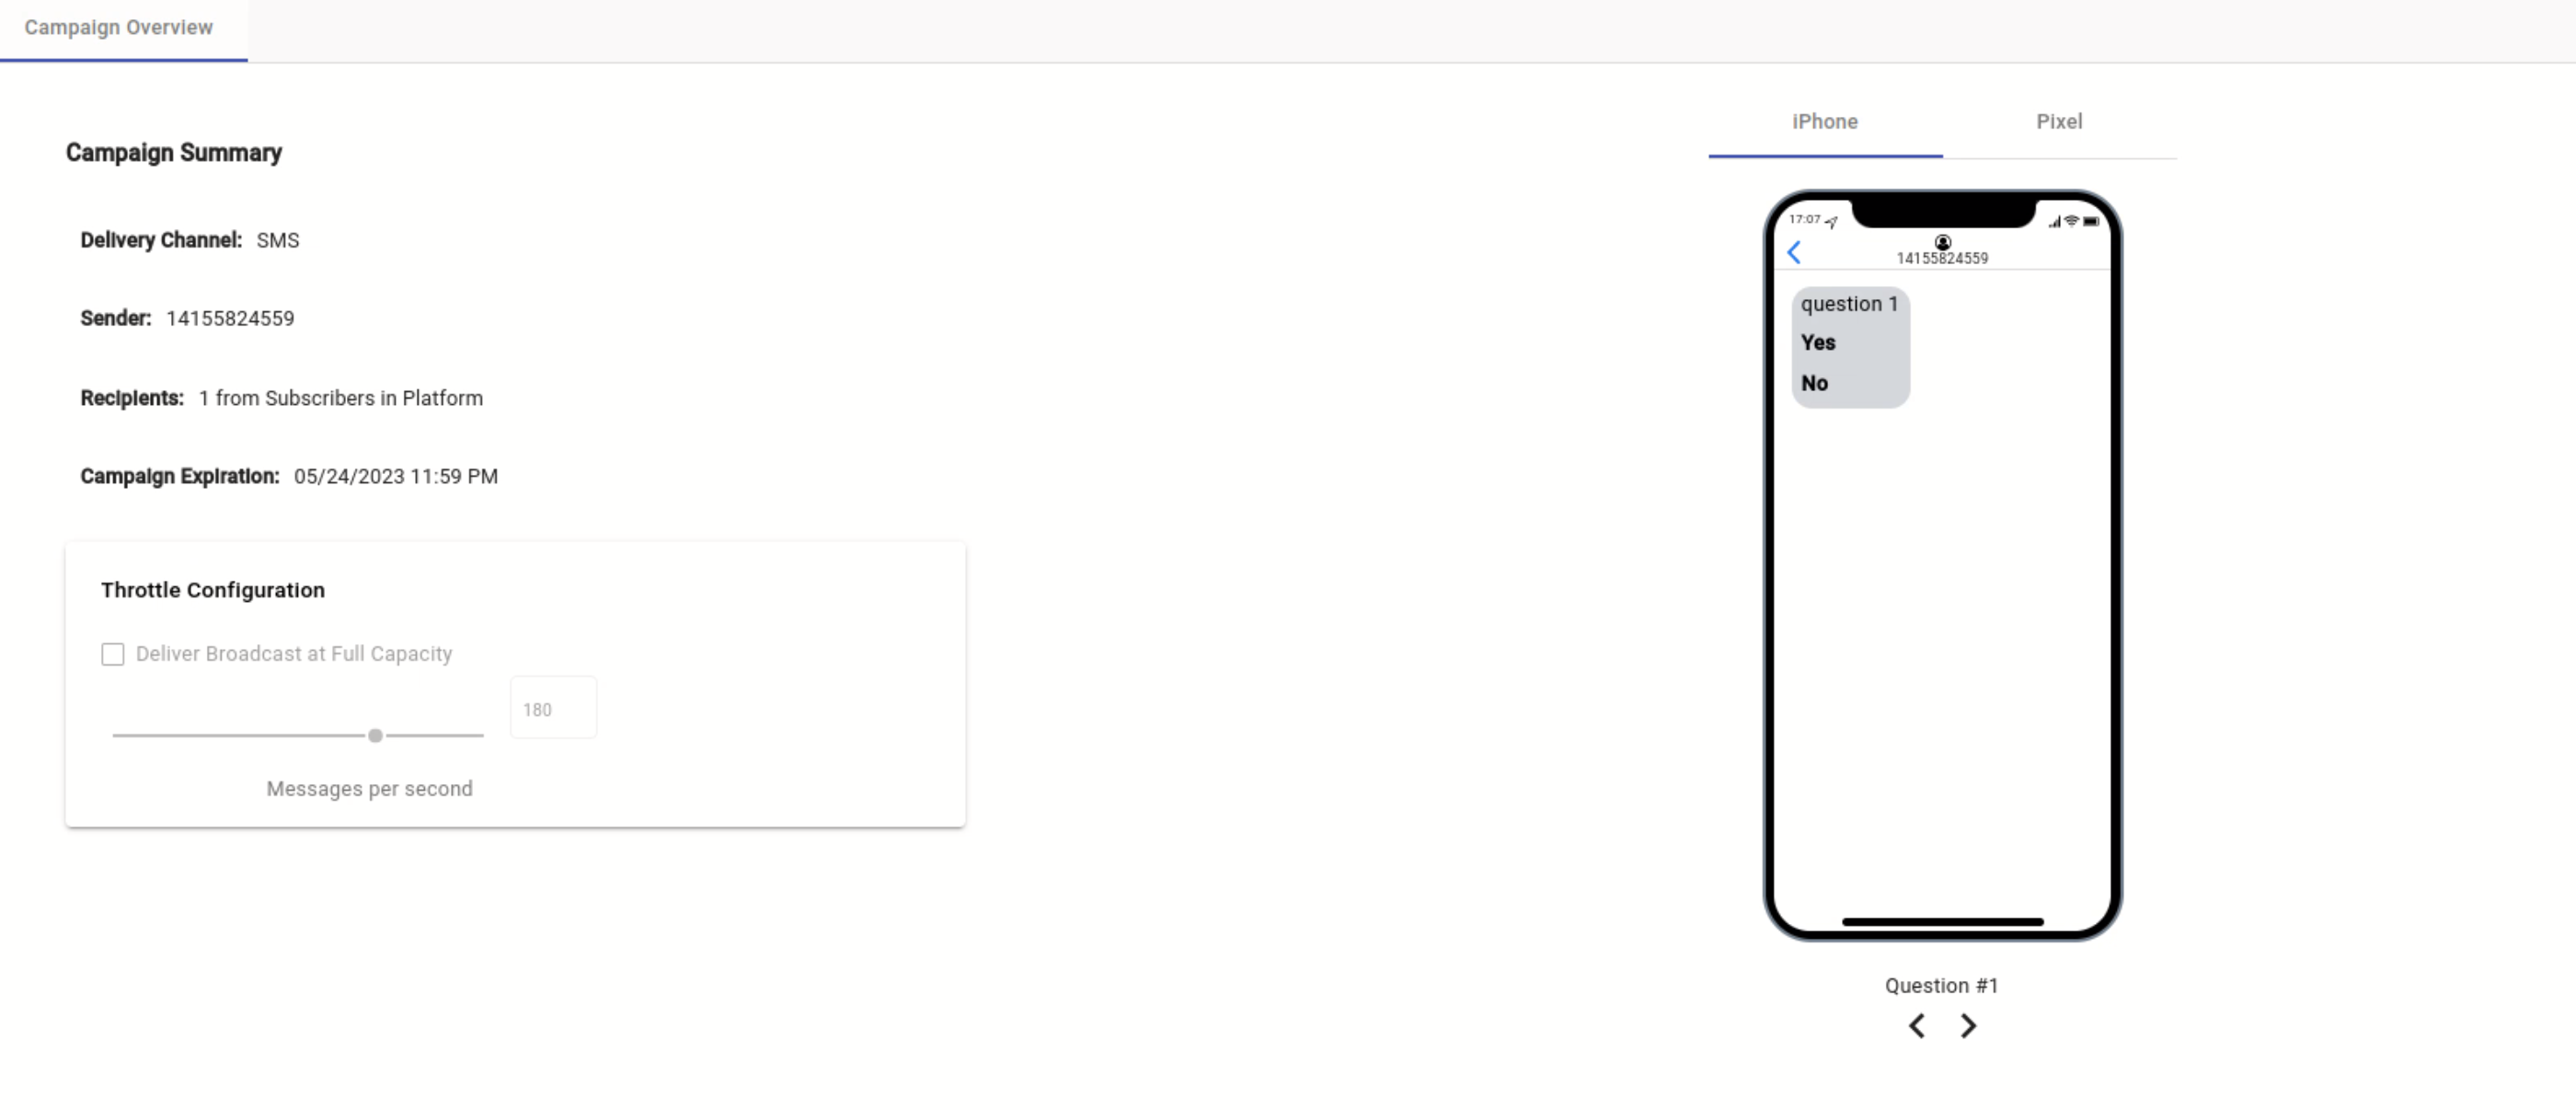
Campaign Overview tab
You review automation configuration and polls & surveys content appearance in this section.
-
Delivery Channel: Type of channel (SMS, WhatsApp, RCS) through which the automation was sent.
-
Sender: The sender type selected during automation setup is used as the sender of the notification message.
-
Recipients: Number of Recipients who received the automation.
-
Campaign Expiration: Configured date on which the automation will expire.
-
Throttle Configuration: Set through the slider, the rate at which the messages will be sent.
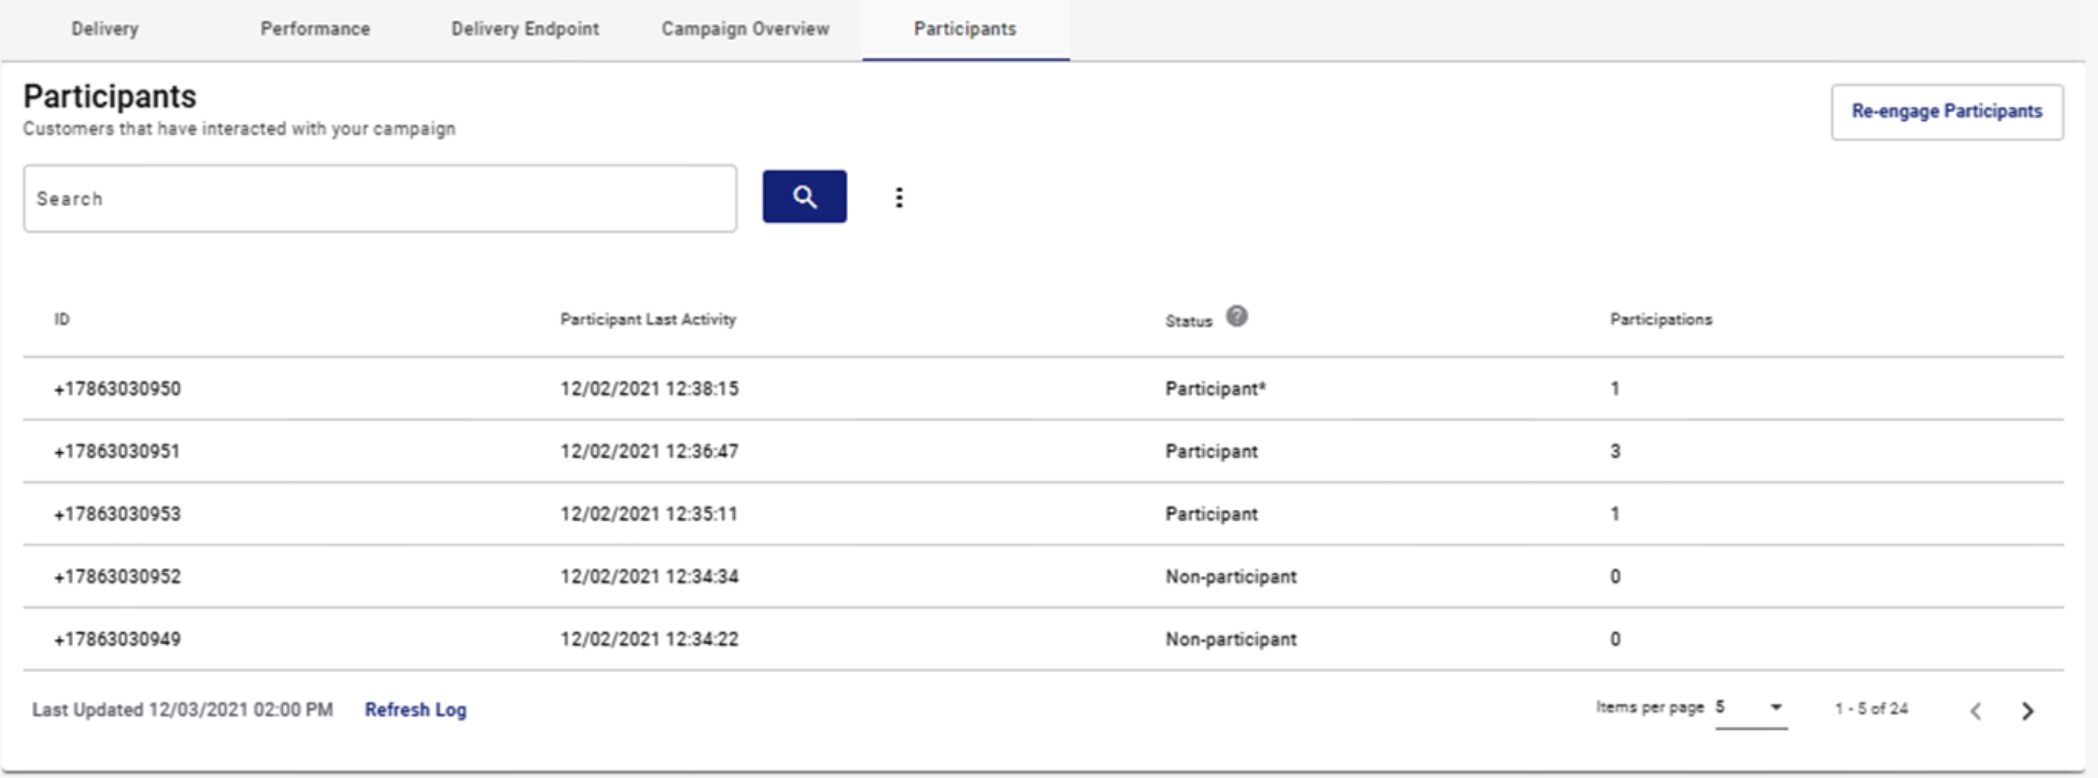
Participants tab
The Participants tab provides a detailed view of individual user engagement throughout the automation. You analyze how each user interacts and segment audiences by level of involvement. Optional winner selection features support prize-based incentives.
The Participants section covers configuration and usage details.
Updated 19 days ago