
Conversations dashboard
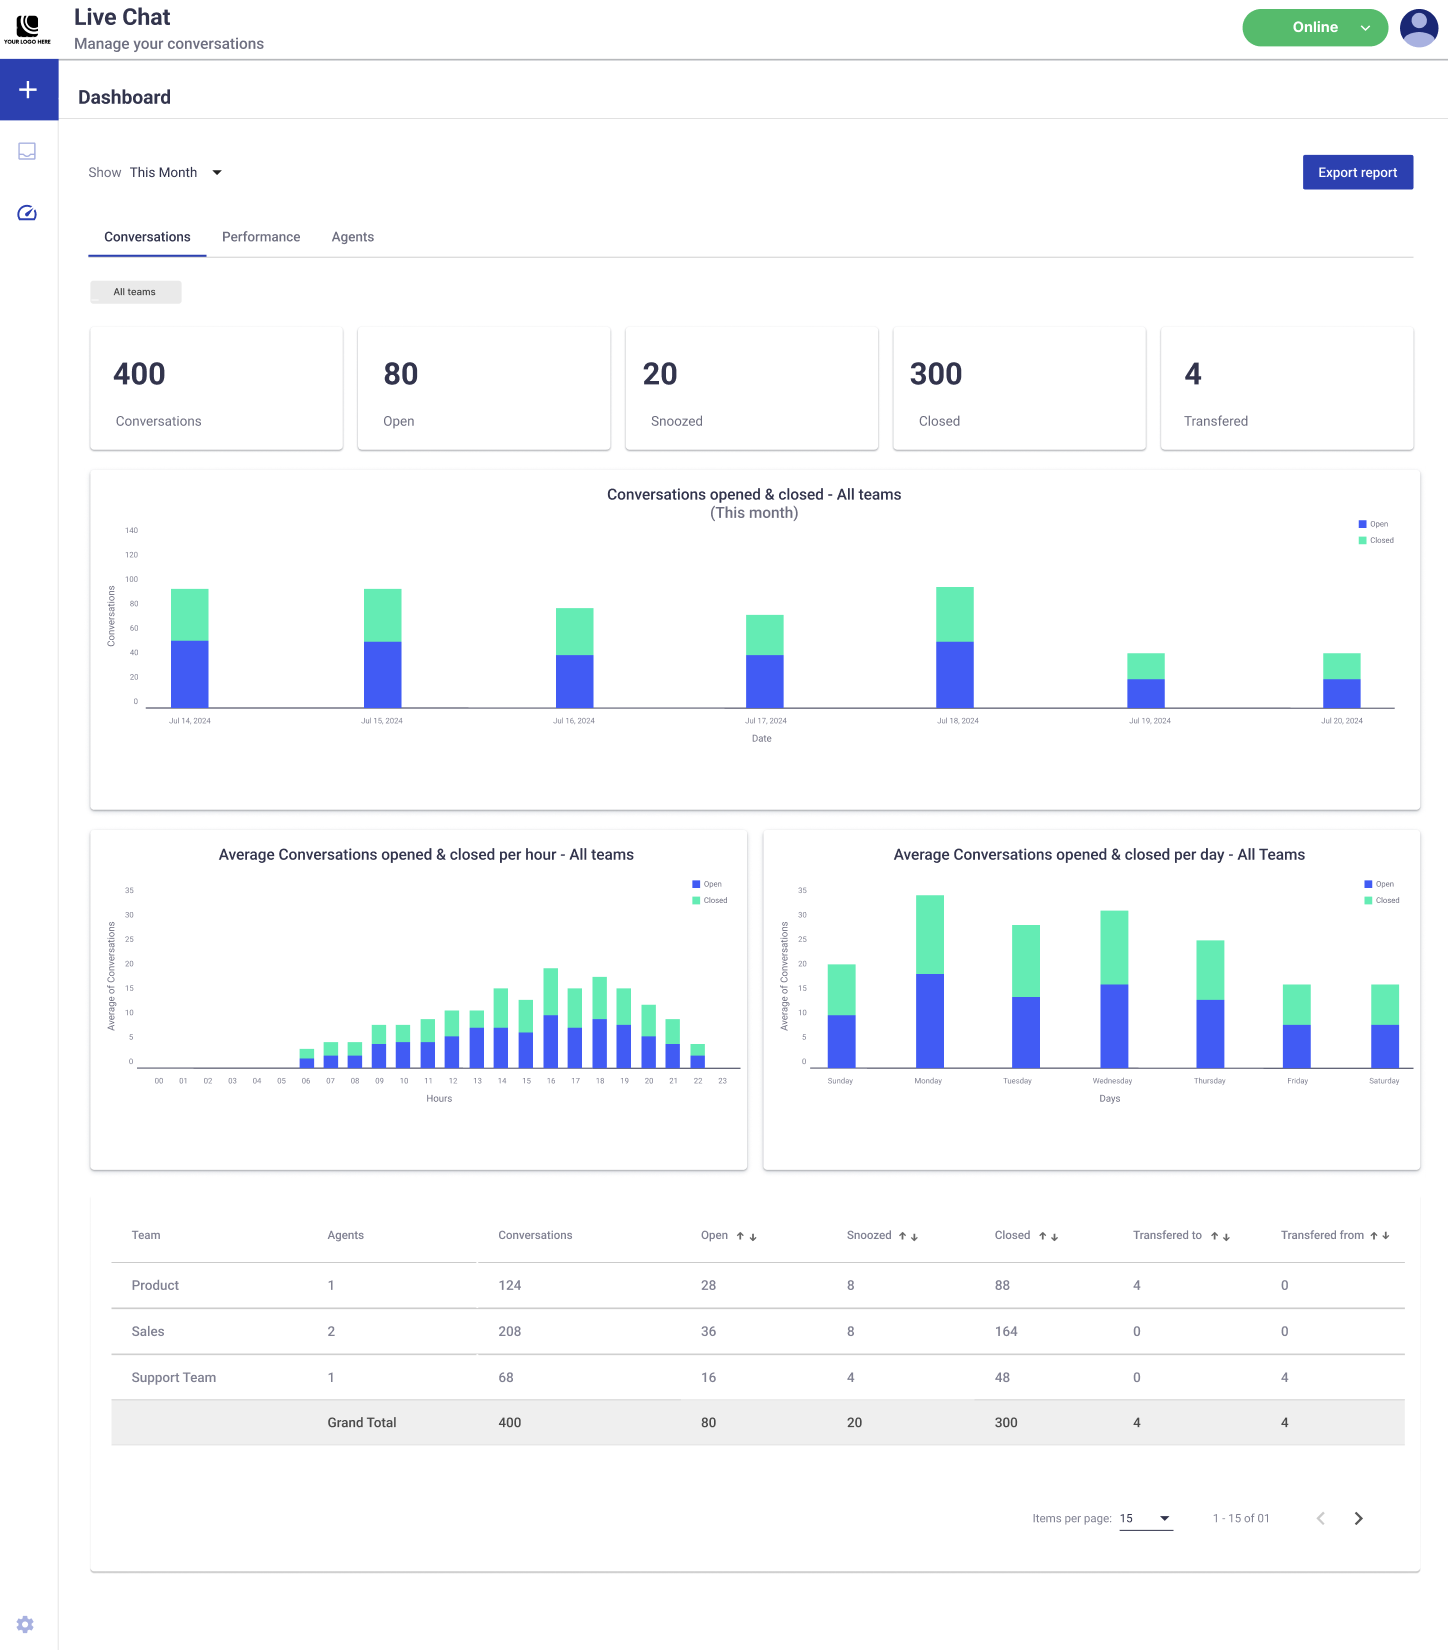
Monitor live chat conversation volume, statuses, graphs, and team performance metrics in the Conversations dashboard.
Use the Conversations dashboard to monitor live chat volume, conversation status, and team performance across a selected date range.
Filters
Select filters before reviewing KPIs, graphs, and team performance data.
| Filter | Location | What it does |
|---|---|---|
| Date range | Top of the dashboard | Filters data by a specific date range. The selected range applies to the Conversations, Performance, and Agents tabs. |
| Team | Top-left corner of the tab | Shows data for all teams or filters the dashboard to one team. Use this filter to focus on a specific team’s performance. |
KPIs
KPIs (key performance indicators) summarize conversation activity for the selected date range.
| KPI | Description |
|---|---|
| Conversations | Total conversations handled. |
| Open | Conversations that are still open and awaiting resolution. |
| Snoozed | Conversations that are temporarily paused for later follow-up. |
| Closed | Conversations resolved and closed. |
| Transferred | Conversations transferred between agents or teams. |
Graphs
Use the graphs to identify trends, peak activity hours, and busy days during the selected date range.
- Conversations opened and closed: Shows the trend of opened and closed conversations over time.
- Compare bar heights to review conversation volume across the selected period.
- Compare Open (blue) and Closed (green) to determine whether teams are keeping up with demand.
- Average conversations opened and closed per hour: Shows the hourly average of opened and closed conversations.
- Identify peak activity hours.
- Use peaks to find the busiest hours for new and resolved conversations.
- Average conversations opened and closed per day: Shows the average number of conversations opened and closed on each day of the week.
- Identify the days with the most activity.
- Review day-level trends when scheduling team shifts and resources.
Team performance table
Use the Team performance table to compare conversation metrics by team during the selected date range.
| Column | Description |
|---|---|
| Team | Team managing the conversations, such as Product, Sales, or Support. |
| Agents | Number of agents assigned to the team. Use this value to understand team capacity. |
| Conversations | Total conversations handled by the team. |
| Open | Conversations still open and unresolved. Use this value to understand current workload. |
| Snoozed | Conversations snoozed by the team for pending follow-up. |
| Closed | Conversations resolved and closed by the team. Use this value to understand resolution activity. |
| Transferred to | Conversations transferred from this team to another team or agent. |
| Transferred from | Conversations this team received from another team or agent. |
Updated 24 days ago