
Chatbot summary / analytics & reporting
Review the chatbot's name, type, delivery channel, sender, and keywords, then activate the automation from the Summary step. For teams confirming configuration before launch and monitoring recipient activity afterward.
The Summary step is where you take the final actions to set up your Chatbot Service and have a chance to review some of its configuration aspects. It is divided into three sections,
- Overview,
- Automation Activation, and the
- Emulated device screen
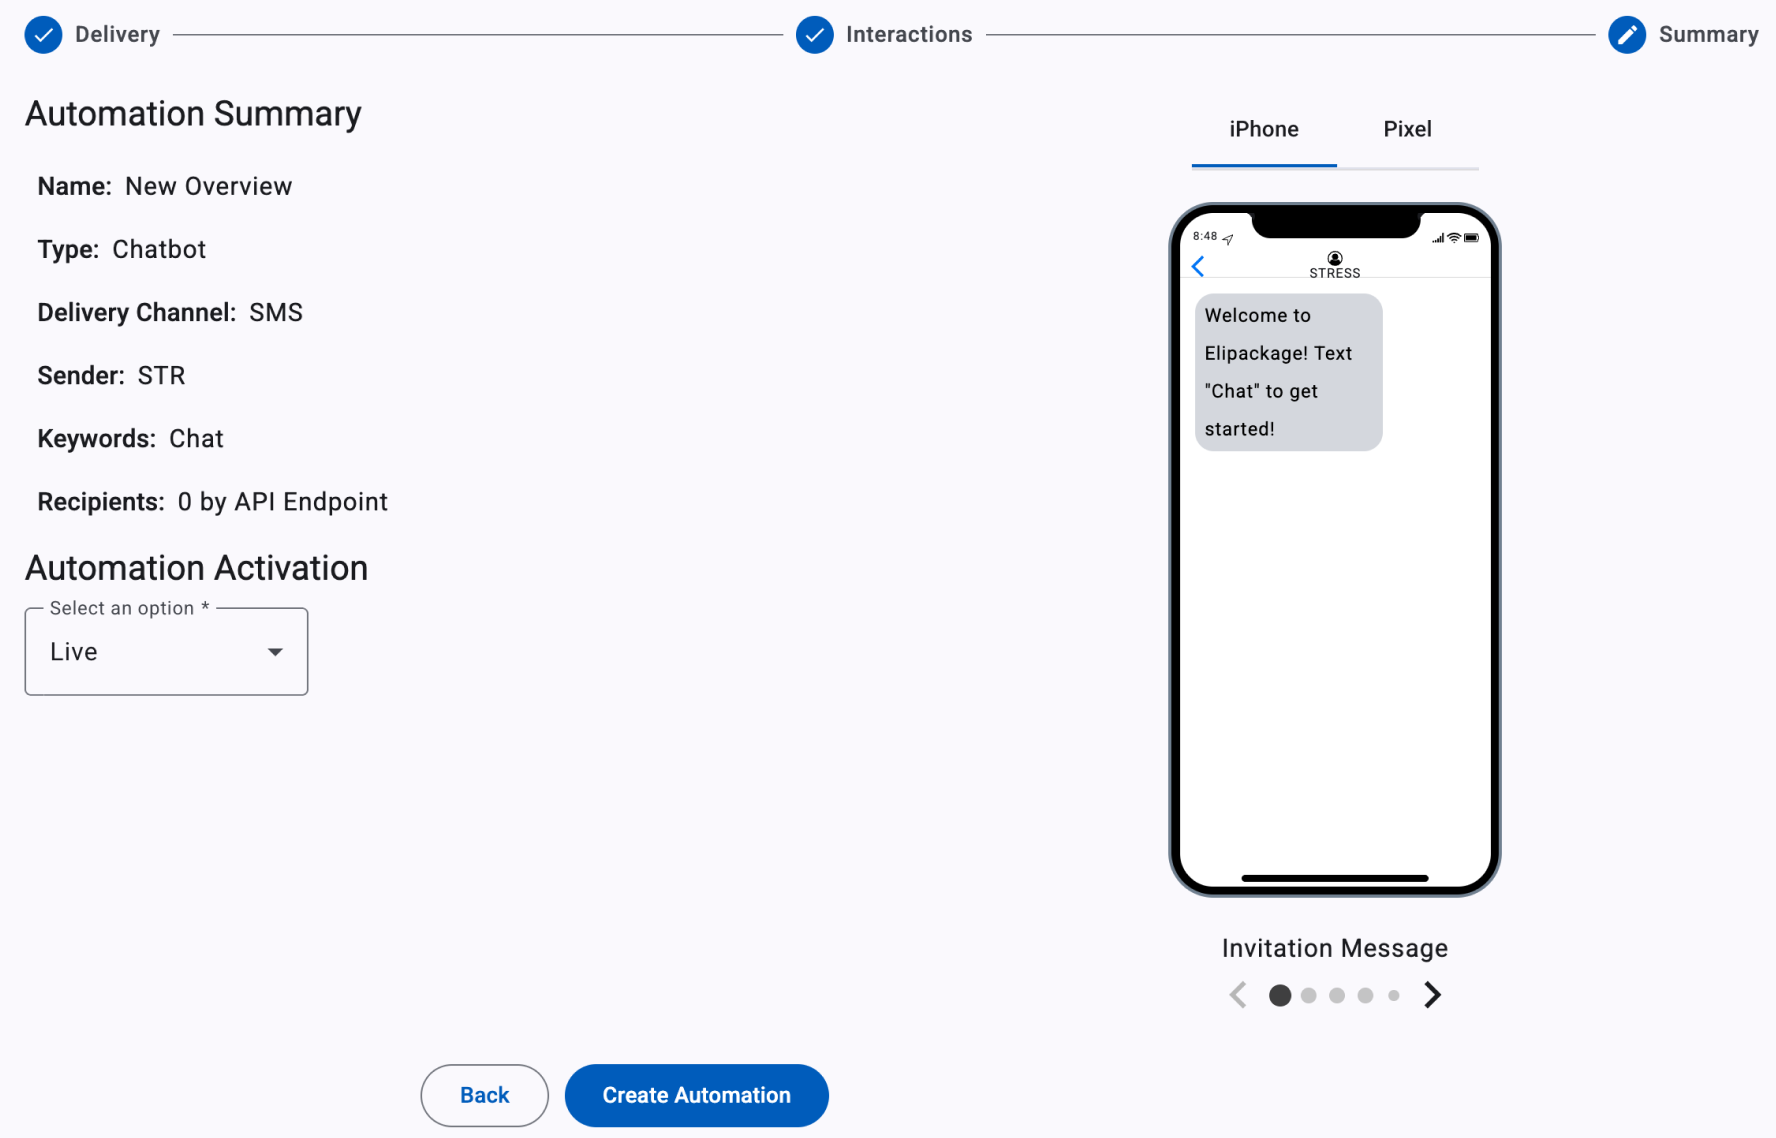
The summary step
Overview
In the Overview section, get to review some of the properties of the chatbot configuration.
- Name: identifies how the chatbot automation is referred to within the platform,
- Type: Displays the automation type.
- Delivery Channel: identifies the engagement channel used for the service
- Sender: It identifies the entity within the platform through which the service is available
- Keywords: identifies all the keywords that invoke the Chatbot Service
- Recipients: After the chatbot is placed into service, it will identify the number of users who have used it
Automation Activation
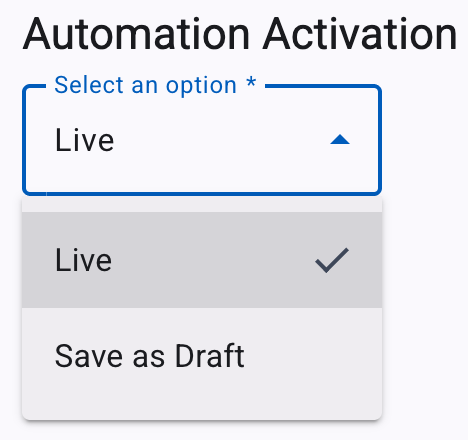
It offers two options,
-
Live, will put the automation into service at once.

-
Save as Draft, will place it on hold, saving it in the Analytics & Reporting section of the User Interface in Draft status

Emulated device screen
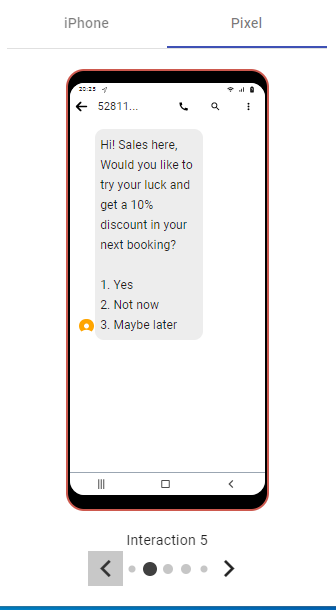
In the emulated device screen, you can review the messages and the menu options for the entire chatbot through the use of the left and right arrows under it.
Reporting
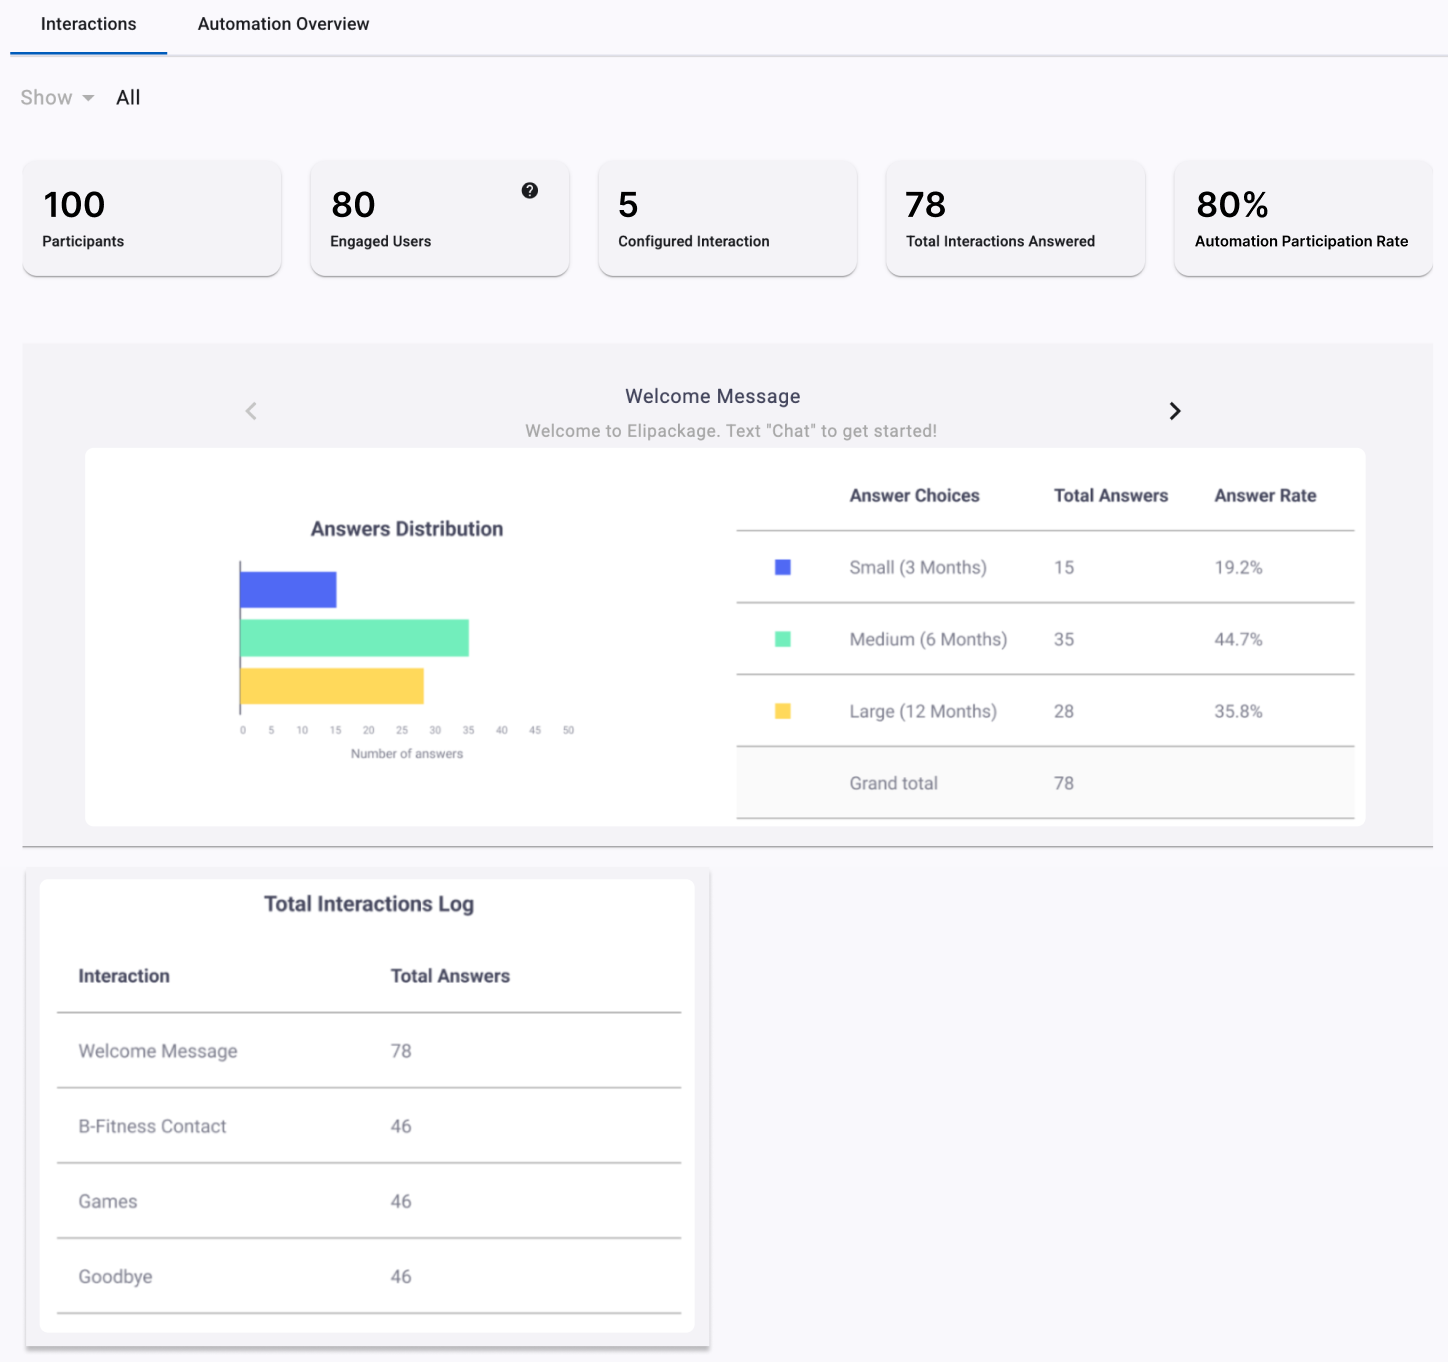
In this section, we analyze the participation of the end users for each interaction. We keep a record of interactions to find out which answer options users interact with the most.
Date range filter
It is a filter that allows users to specify a start date and an end date for the data they want to view or analyze within the reporting. This filter helps in narrowing down the information to a specific period, making it easier to analyze trends, patterns, or specific events that occurred within that time frame. By using a date range filter, users can focus on relevant data, compare different periods, and make more informed decisions based on the time-specific insights the reporting provides.
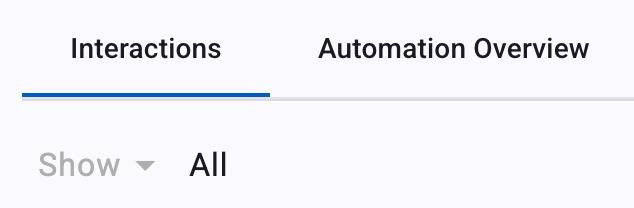
Furthermore, this feature not only enables you to filter data by specific date ranges but also lets you view all data generated from the start of the automation up to the current moment by selecting the 'All' option.
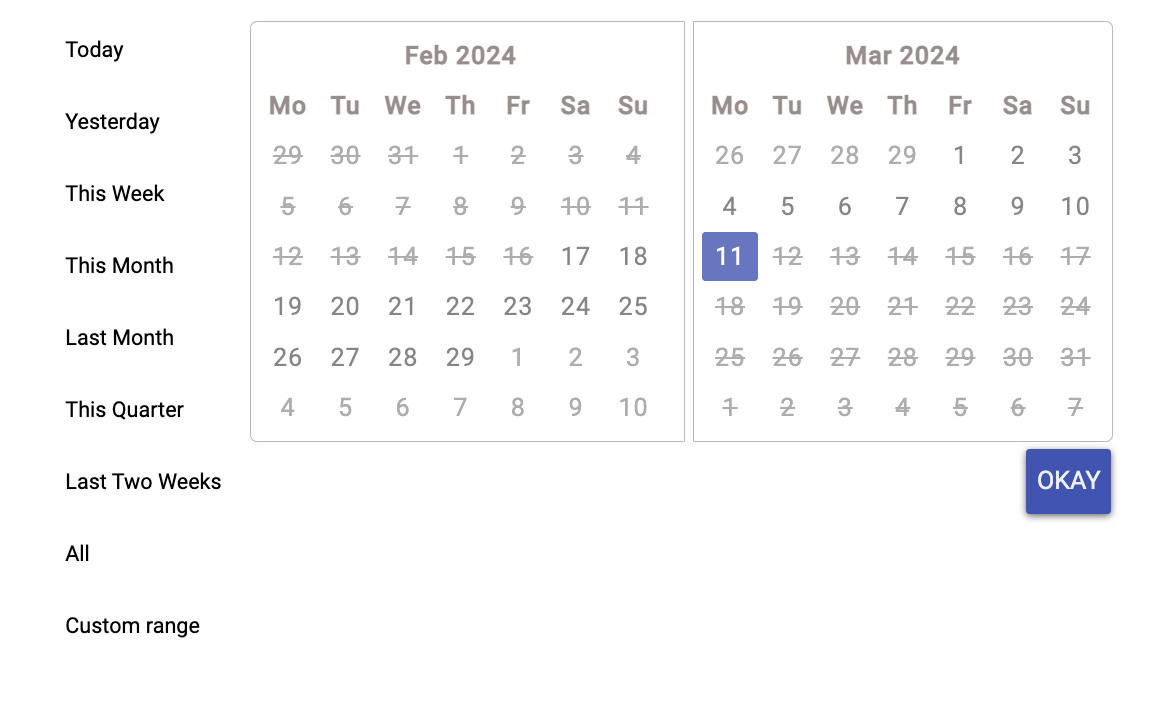
NOTEThe date range feature will apply a filter to the entire report, excluding the Total Interactions KPI.
KPIs
In this section, we describe the main KPIs located at the top of the Interactions tab.

-
Total Participants: Total number of unique end users who have participated in the chatbot.
-
Engaged Users: Users who have interacted with the automation beyond the "Welcome Message".
-
Configured Interaction: Total number of interactions that have been created. For example, if the customer configured 4 interactions, but only the end users have interacted with 3 interactions, the 4 interactions configured in the automation will be displayed in the KPI.
-
Total Interactions Answered: The total number of answers for each interaction received from the chatbot.
-
Automation Participation Rate: Determine the percentage (%) of participation of the total number of end users who participated in the chatbot and the total number of end users who participated in any automation. That is, of the total number of contacts who received the chatbot, how many of those contacts selected any automation.
Answers Distribution
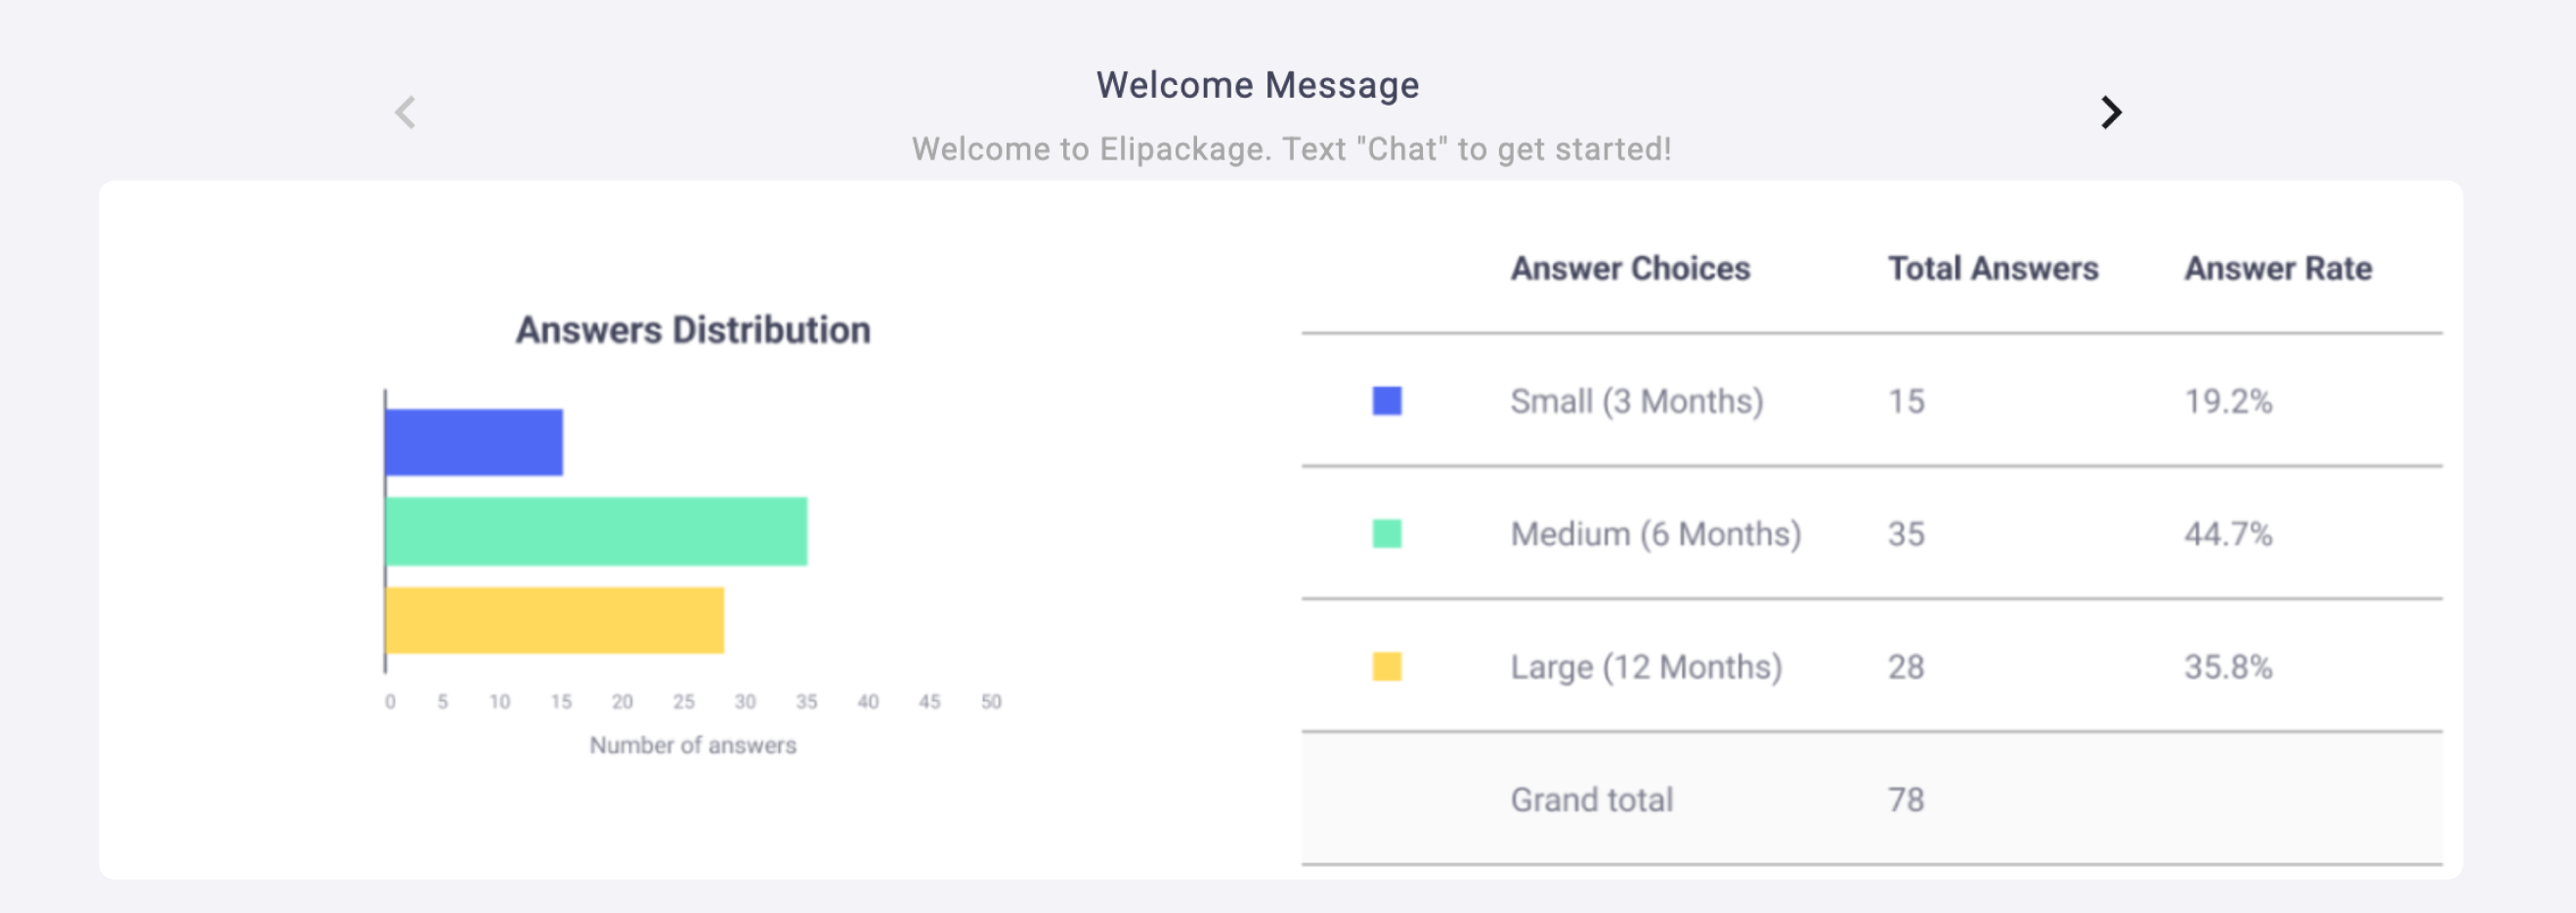
In this section, the bar chart “Answers Distribution” displays the total responses for each single-interaction answer option.
Total answers log
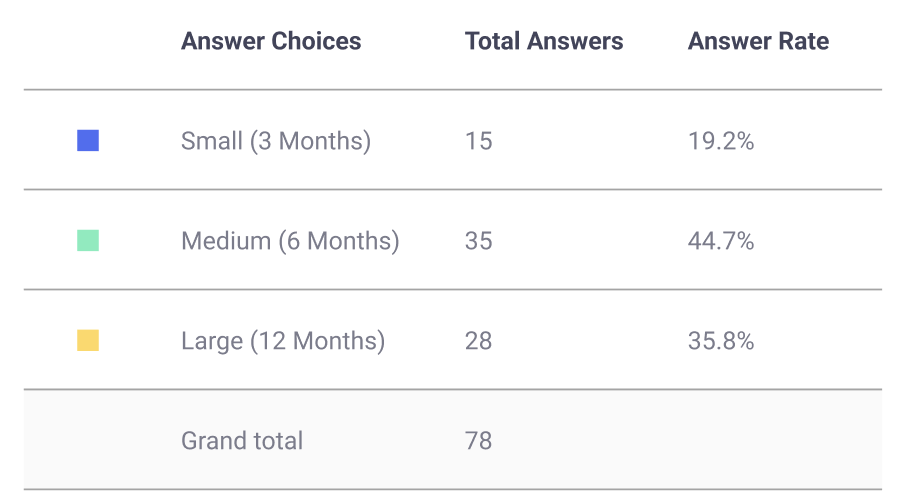
In this section, the following table displays the total responses for each single-interaction answer option with its respective answer rate.
| Columns | Description |
|---|---|
| Answer Choices | Interaction answer options. |
| Total Answers | Total responses for each single-interaction answer option. The Grand Total gets the sum for each Answer option for each Interaction. |
| Answer Rate | Percentage of response rate. |
Top interactions log
In this section, the following table displays each interaction with its respective total answers. This table helps the customer visualize which interaction users interact the most.
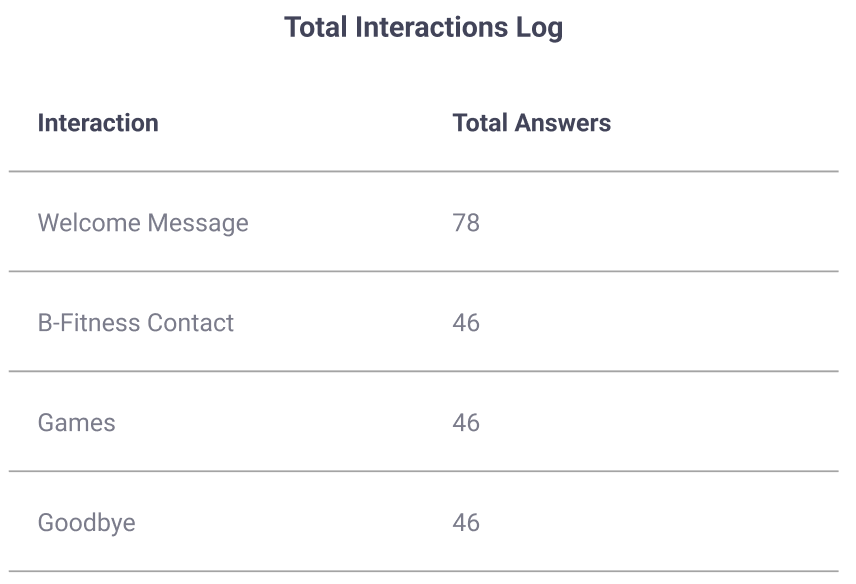
The Top Interactions Log table consists of the following columns:
| Columns | Description |
|---|---|
| Interaction | Name of the interaction (Interaction Label). |
| Total Answers | Total number of answers that each interaction got from end users. |
Updated 30 days ago