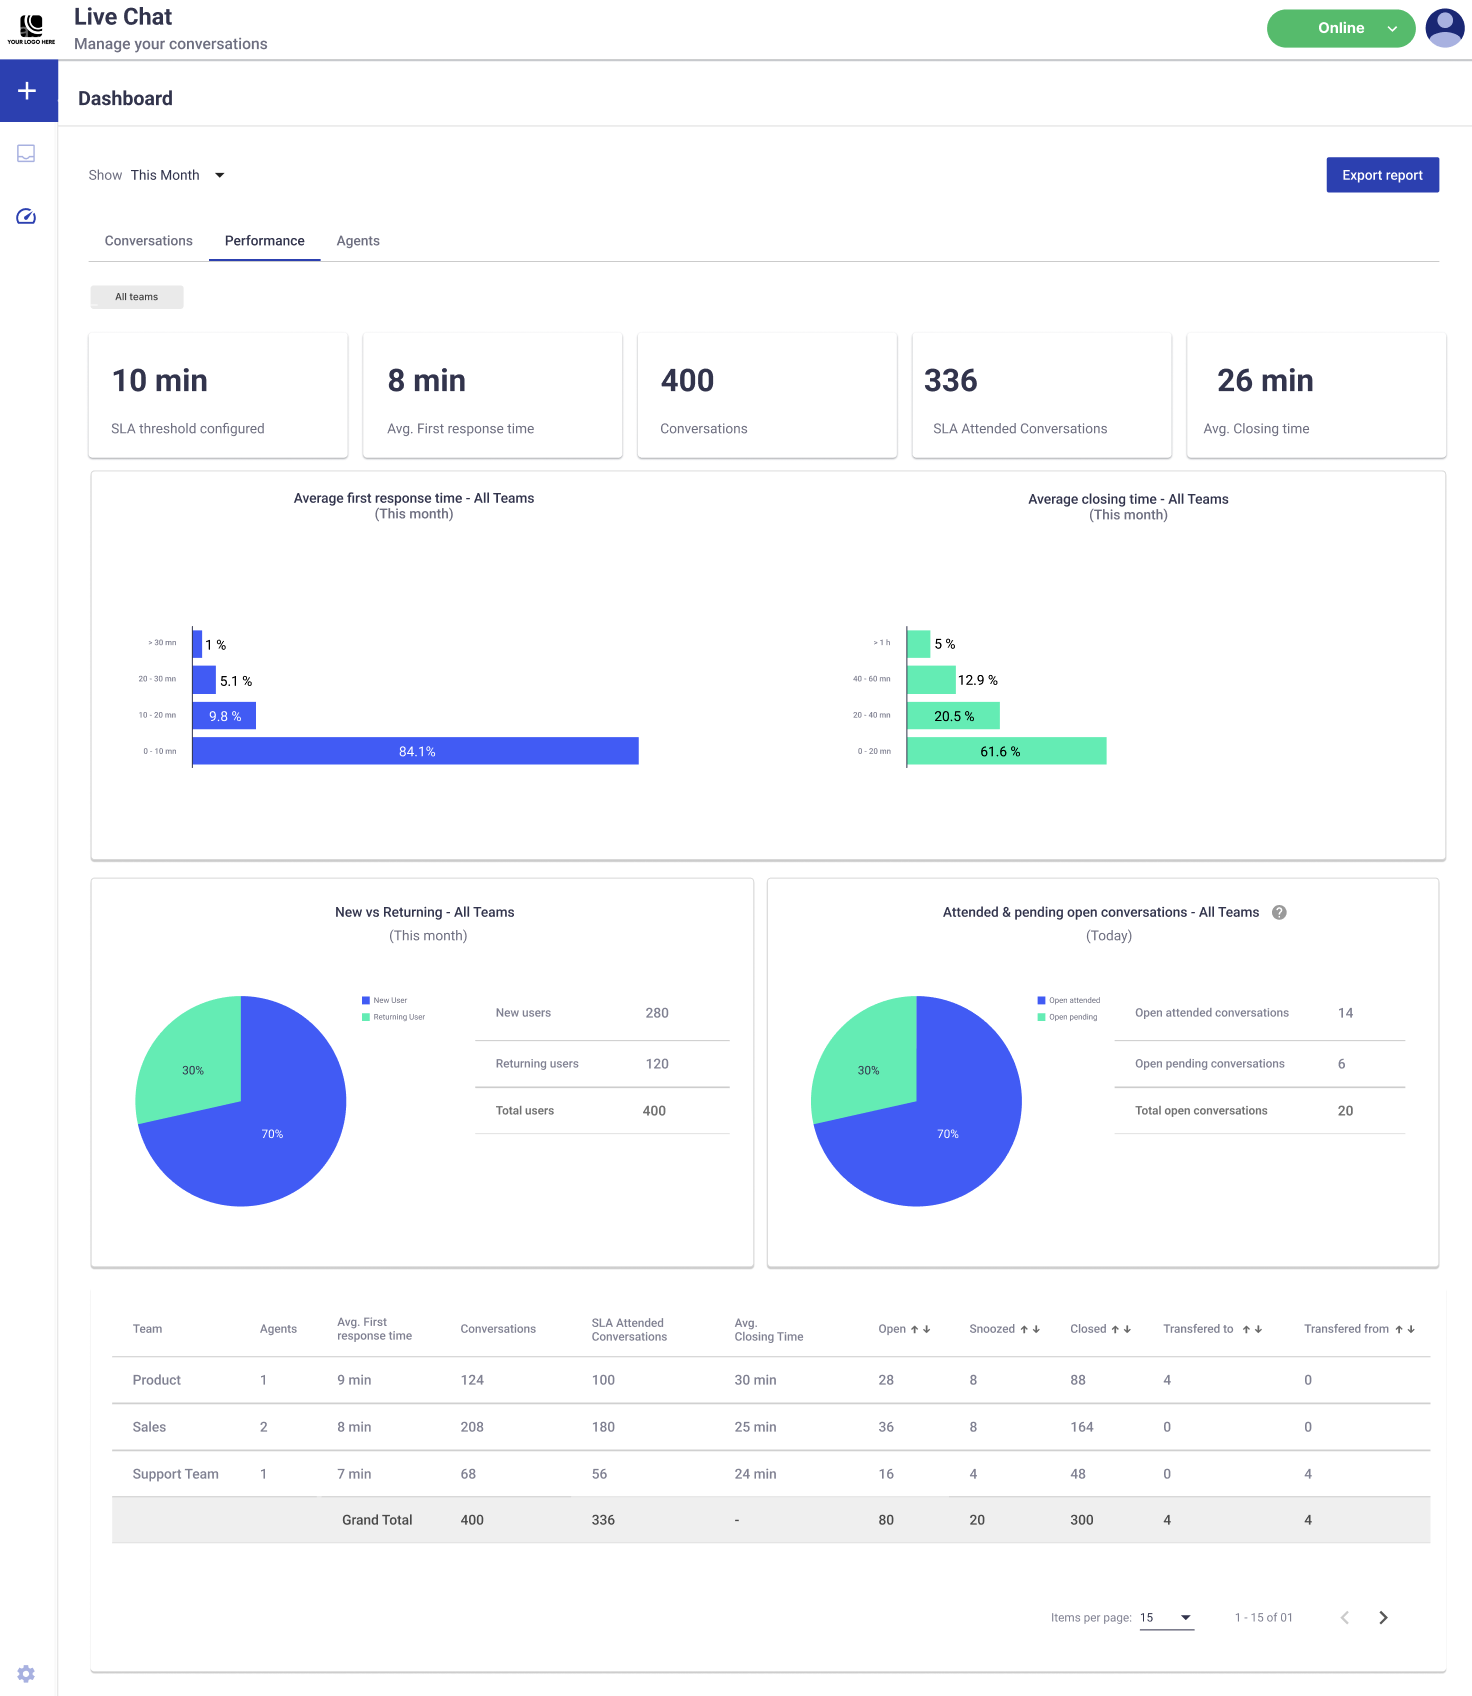
Performance dashboard
The Performance dashboard provides insights into the efficiency and responsiveness of teams handling live chat conversations. It features KPIs, graphs, and tables to help monitor and improve team performance and monitor the SLA Attended Conversations metric to identify whether conversations are being resolved within the expected time. Here’s a breakdown of each component:

Filters
- Date Range Filter:
- Located at the top of the dashboard.
- Allows filtering the displayed data by a specific date range. Changes apply across all three tabs (Conversations, Performance, Agents).
- Team Filter:
- Located at the top-left corner of the tab.
- Allows you to collectively view data for all teams or filter per team to focus on its performance.
KPIs (Top Metrics)
- SLA Threshold Configured: The maximum time limit (in minutes) is set as the service level agreement (SLA) for responding to conversations. That is, The maximum time limit, in minutes, set for this service, within which an agent must respond to a conversation to ensure prompt response quality standards are met.
- Avg. First Response Time: The average time taken by teams to provide the first response to a user query according to the selected time period. A lower value indicates faster responsiveness.
- Conversations: The total number of conversations handled during the selected period. Reflects the overall workload.
- SLA Attended Conversations: The number of conversations attended to within the SLA threshold according to the selected time period. Indicates adherence to SLA commitments.
- Avg. Closing Time: The average time taken to resolve and close a conversation according to the selected time period. Lower values indicate higher efficiency in resolving issues.
Graphs
- Average First Response Time: Displays the percentage distribution of first response times broken into intervals (e.g., 0–10 min, 10–20 min) according to the selected time period.
- Bars show the percentage average of conversations responded to within each time range.
- The largest percentage (e.g., 84.4% within 0–10 min) highlights where most responses occur.
- A higher percentage in intervals exceeding the configured SLA threshold suggests underperformance in team operations.
- Average Closing Time: Visualizes the percentage distribution of closing times broken into intervals (e.g., 0–20 min, 20–40 min) according to the selected time period.
- Bars show the percentage average of conversations resolved and closed within each time range.
- A higher percentage in the lower time ranges (e.g., 37.1% within 0–20 min) indicates efficient resolution times.
- New vs. Returning Users: A pie chart showing the percentage of new users versus returning users according to the selected time period.
- Displays information about customers who have interacted with agents more than one time and those engaging with an agent for the first time.
- Attended & Pending Open Conversations (Today): A pie chart showing the percentage of attended open conversations and pending open conversations for the current day.
- Helps monitor real-time workload and identify whether conversations are being addressed promptly.
- This chart is unaffected by the Date Range filter and exclusively shows data for the current day.
- If no data is available for the selected time period, the graph will not be displayed. This may occur if the graph is viewed on a day with no activity from end users.
Teams Performance table
The table at the bottom provides a detailed breakdown of conversation metrics per team during the selected time period.
- Team: The name of the team managing the conversations (e.g., Product, Sales, Support).
- Agents: Number of agents assigned to the team. Indicates the team’s capacity for handling conversations.
- Avg. First Response Time: The average time taken by the team to provide the first response to a user query. A lower value indicates faster responsiveness.
- Conversations: Total number of conversations handled by the team during the selected time period.
- SLA Attended Conversations: The number of conversations the team handled within the configured SLA threshold.
- Avg. Closing Time: The team’s average time to close conversations.
- Open: Number of conversations still open and unresolved. Reflects the team’s current workload.
- Snoozed: Number of conversations snoozed by the team. Indicates pending follow-ups.
- Closed: Total number of conversations successfully resolved and closed by the team. Shows the team’s efficiency in addressing queries.
- Transferred To: Number of conversations that were transferred to another team or agent.
- Transferred From: Number of conversations received that were transferred from another team or agent.
Updated 7 months ago
