Messaging Analytics
The Messaging Tab provides detailed insight into all bidirectional messaging activity and delivery performance metrics across channels such as SMS, Email, WhatsApp, and RCS. You use it to track message exchange volumes, delivery success, and sender performance.
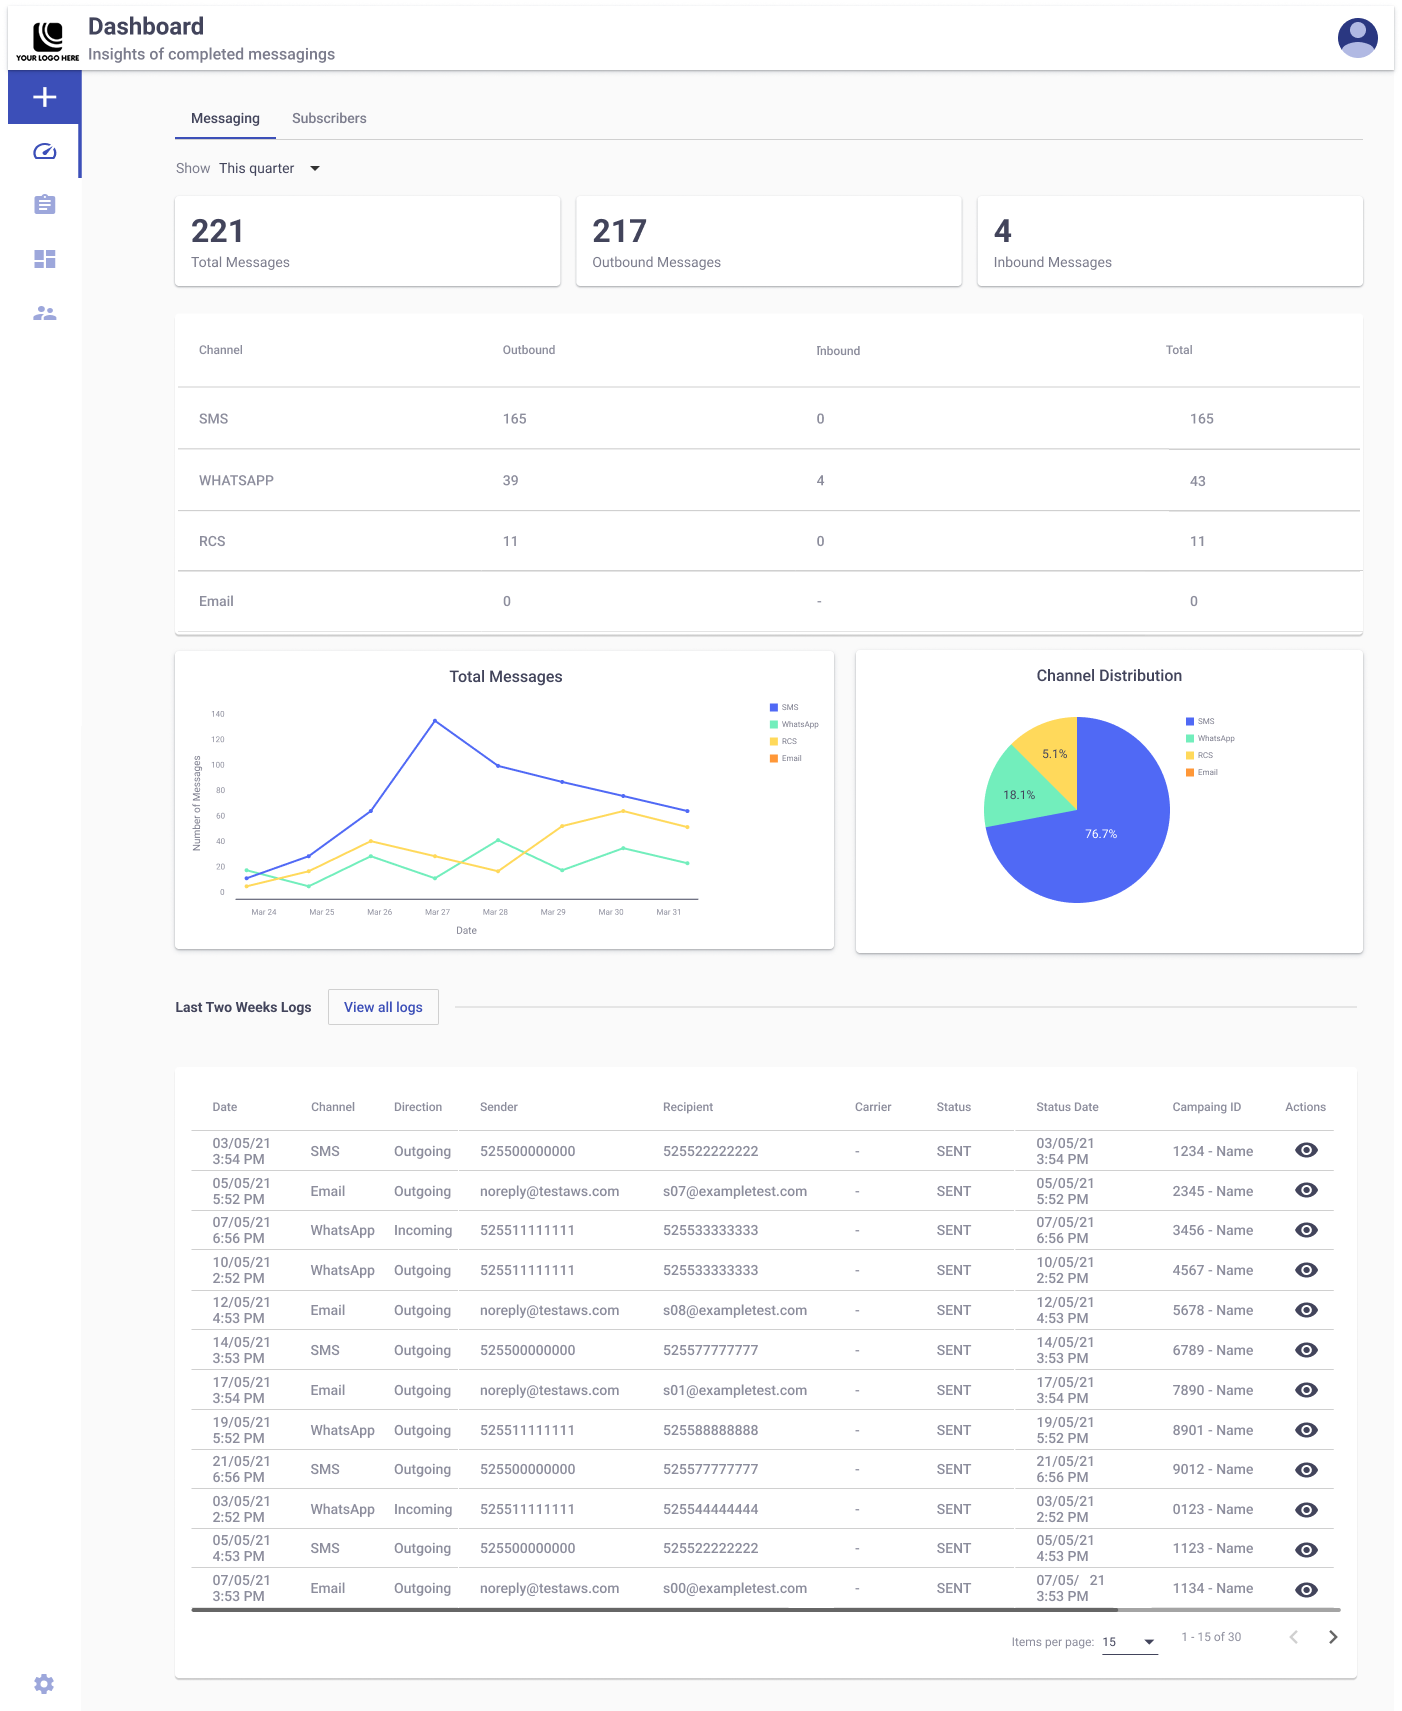
In addition to the Date Range Filter, the tab includes four distinct sections:
- KPI Snapshots, (Total messages exchanged)
- Traffic by Sender
- Breakdown of Messages Exchanged
- General Data Visualization
- Messaging Log
Dashboard
KPIs
The KPI Snapshots correspond to the period defined in the Show Date Range Filter. They represent totals for that period exclusively.

- Total Messages: Total number of Messages exchanged from the Platform through all Delivery Channels (SMS, Email, WhatsApp, and RCS).
- Outbound Messages: Total number of SMS, Email, WhatsApp, and RCS messages sent from the Platform.
- Inbound Messages: Total number of SMS, WhatsApp, and RCS messages received by the Platform.
Messages Exchanged
The Breakdown of Messages Exchanged appears in a table that identifies messages exchanged by channel type. The table includes four columns:
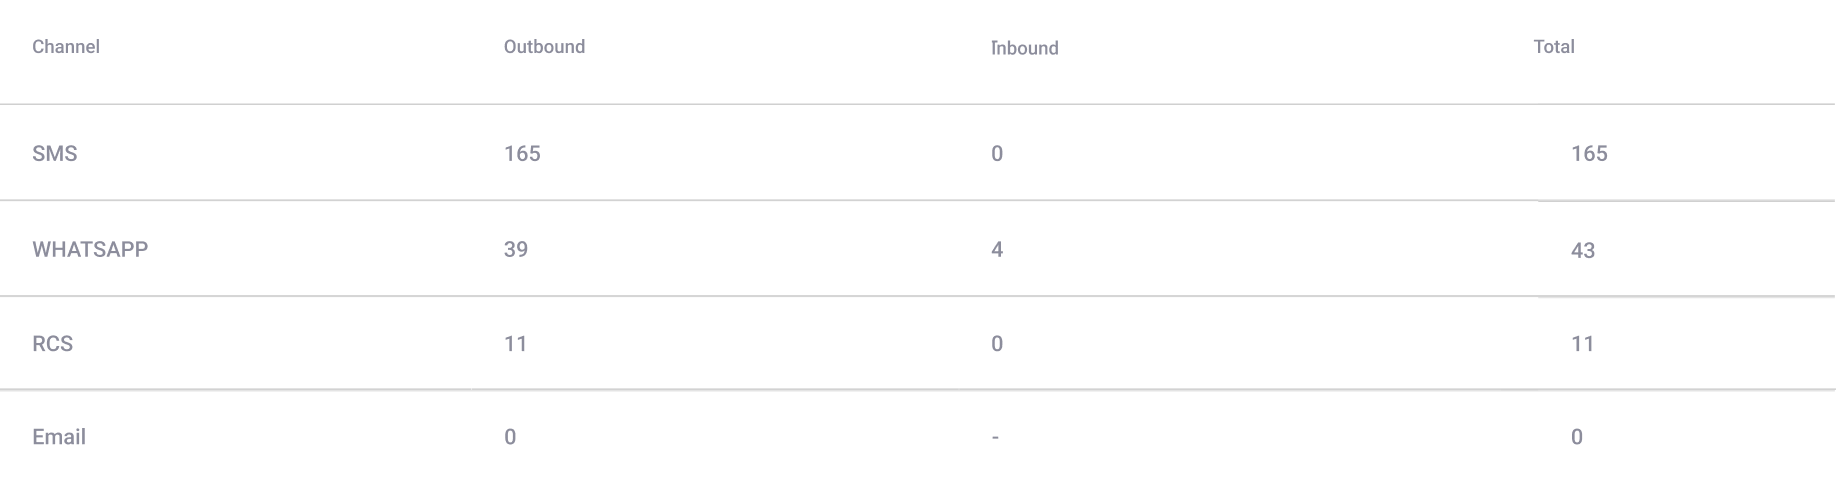
- Channel: Identifies the channel type. SMS, WhatsApp, and RCS are bidirectional; Email is outbound only.
- Outbound: Messages sent by the platform, broken down per channel type.
- Inbound: Messages received by the platform, broken down per channel type. Email is excluded as it is outbound only.
- Total: Sum of Outbound and Inbound exchanges per channel.
You select the Outbound, Inbound, or Total column headers to sort results in ascending or descending order. The Traffic by Sender section covers traffic analysis per sender and channel.
General Data Visualization
The platform provides different types of graphs to visualize data and display statistics on the total messages sent for each delivery channel: SMS, Email, WhatsApp, RCS. Two Data Visualization Graphs appear below the breakdown table:
-
Total Messages Line Graph (Timeline)
-
Channel Distribution Pie Chart
Total Messages
The graph displays the total number of messages on a timeline over the selected Date Range, broken down by channel. A color-coded legend in the top right corner identifies SMS, Email, WhatsApp, and RCS.
By default, the graph displays all channels. You isolate specific channels by selecting them on the color-coded legend to toggle them on or off.
The horizontal axis shows the selected date range. The vertical axis shows the total messages per channel on any given date.
Channel Distribution Pie Chart
The pie chart displays the percentage of messages by channel: SMS, Email, WhatsApp, and RCS.
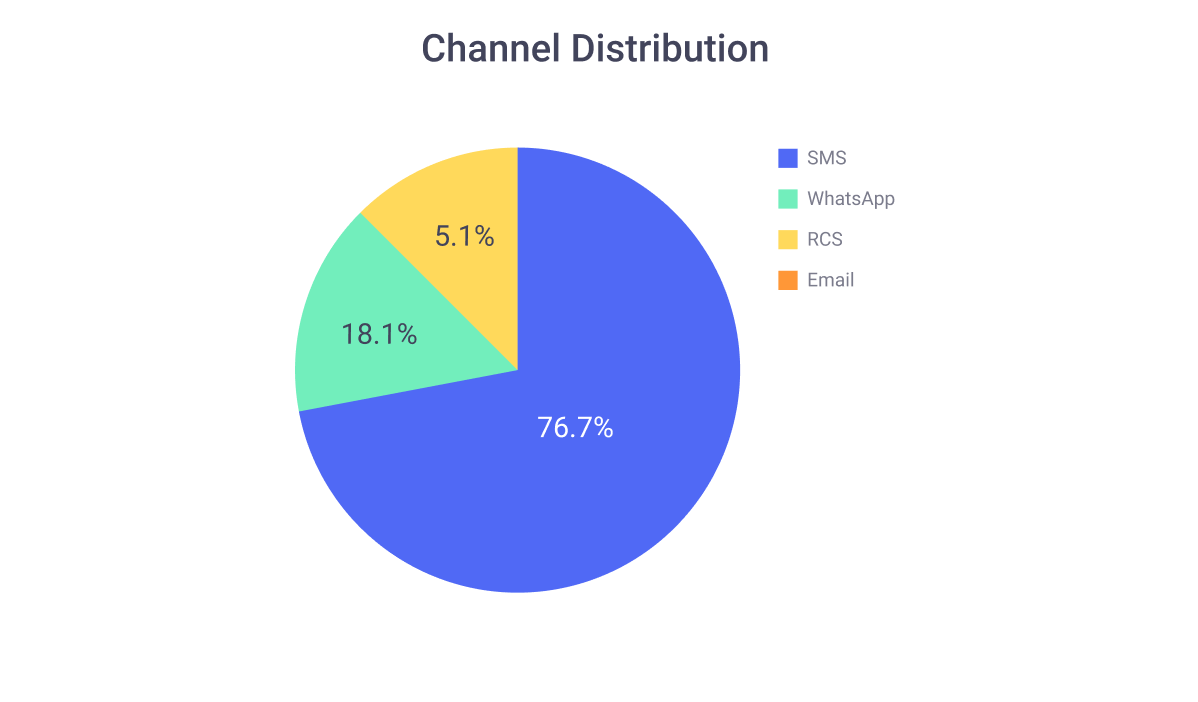
When you hover over the graphs, additional icon options appear for identifying and enhancing the displayed data. Each icon performs the following action:
Messaging Logs
Messaging Logs refer to a detailed and chronological record of all message interactions that occur across the delivery channels, such as SMS, Email, WhatsApp, and RCS. The Messaging Logs section covers each outbound and inbound message record.
Traffic by Sender
You analyze traffic between each sender alongside its respective delivery channel (SMS, Email, WhatsApp, RCS). To access the Traffic by Sender Dashboard, you click the View Details button next to the date range filter.
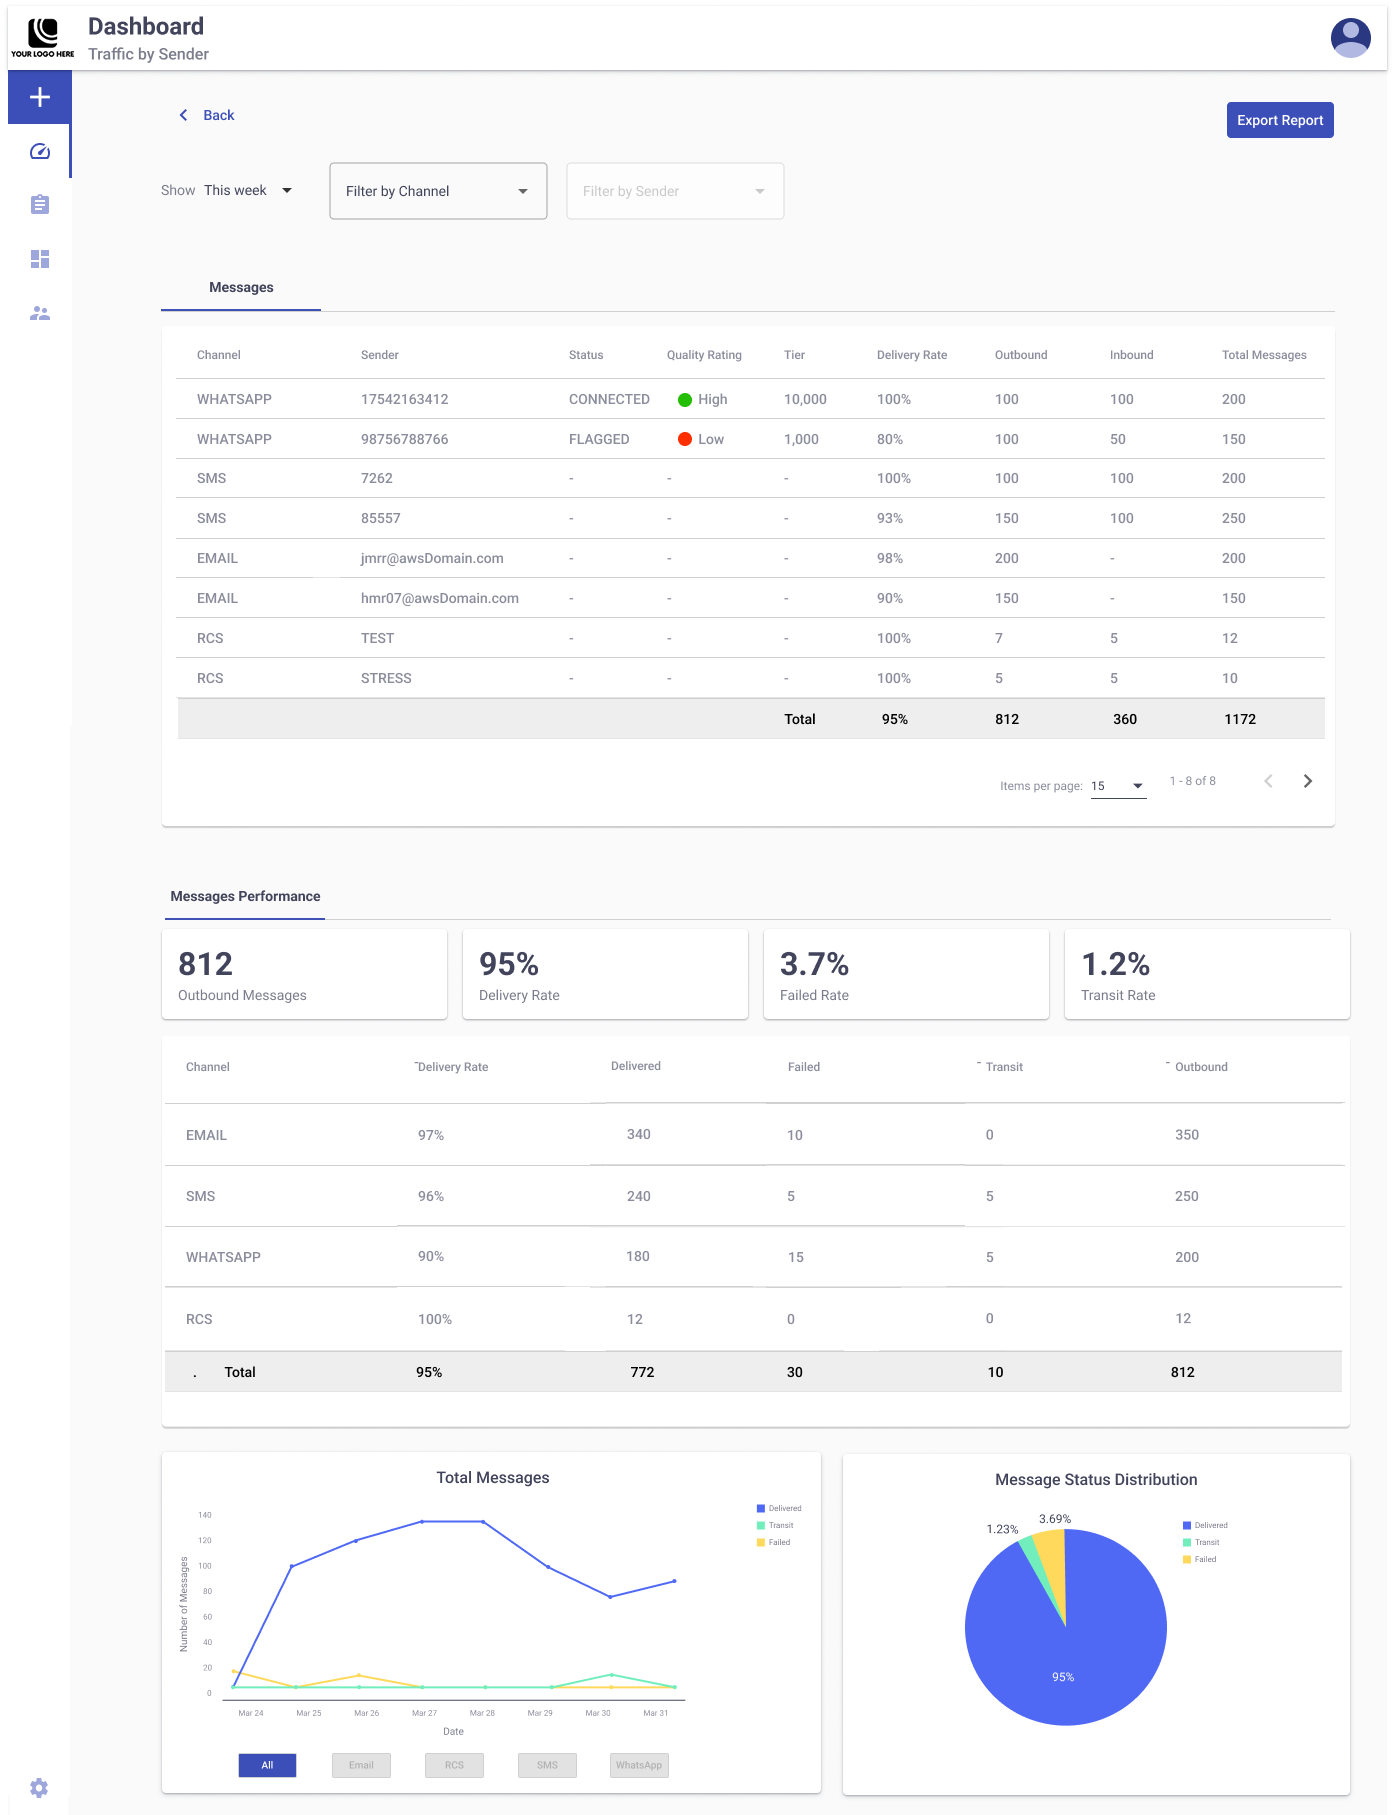
Three tabs show the overall message count per sender in both MT (Outbound) and MO (Inbound) directions, and their status:
NOTEYou are able to apply three filters in the entire analytics & reporting:
- Date Range -> When selecting the "This Week" option, the date range filter could consider Sunday as the first day of the week, depending on the browser's timezone.
- Filter by Channel
- Filter by sender
According to the filter or filters selected, the analytics & reporting data will be filtered in the three tabs.
Messages tab
The Messages tab displays a table summarizing the number of messages sent (MT), received (MO), and delivery rates per sender and channel. It also includes the success rate of delivered messages per sender.
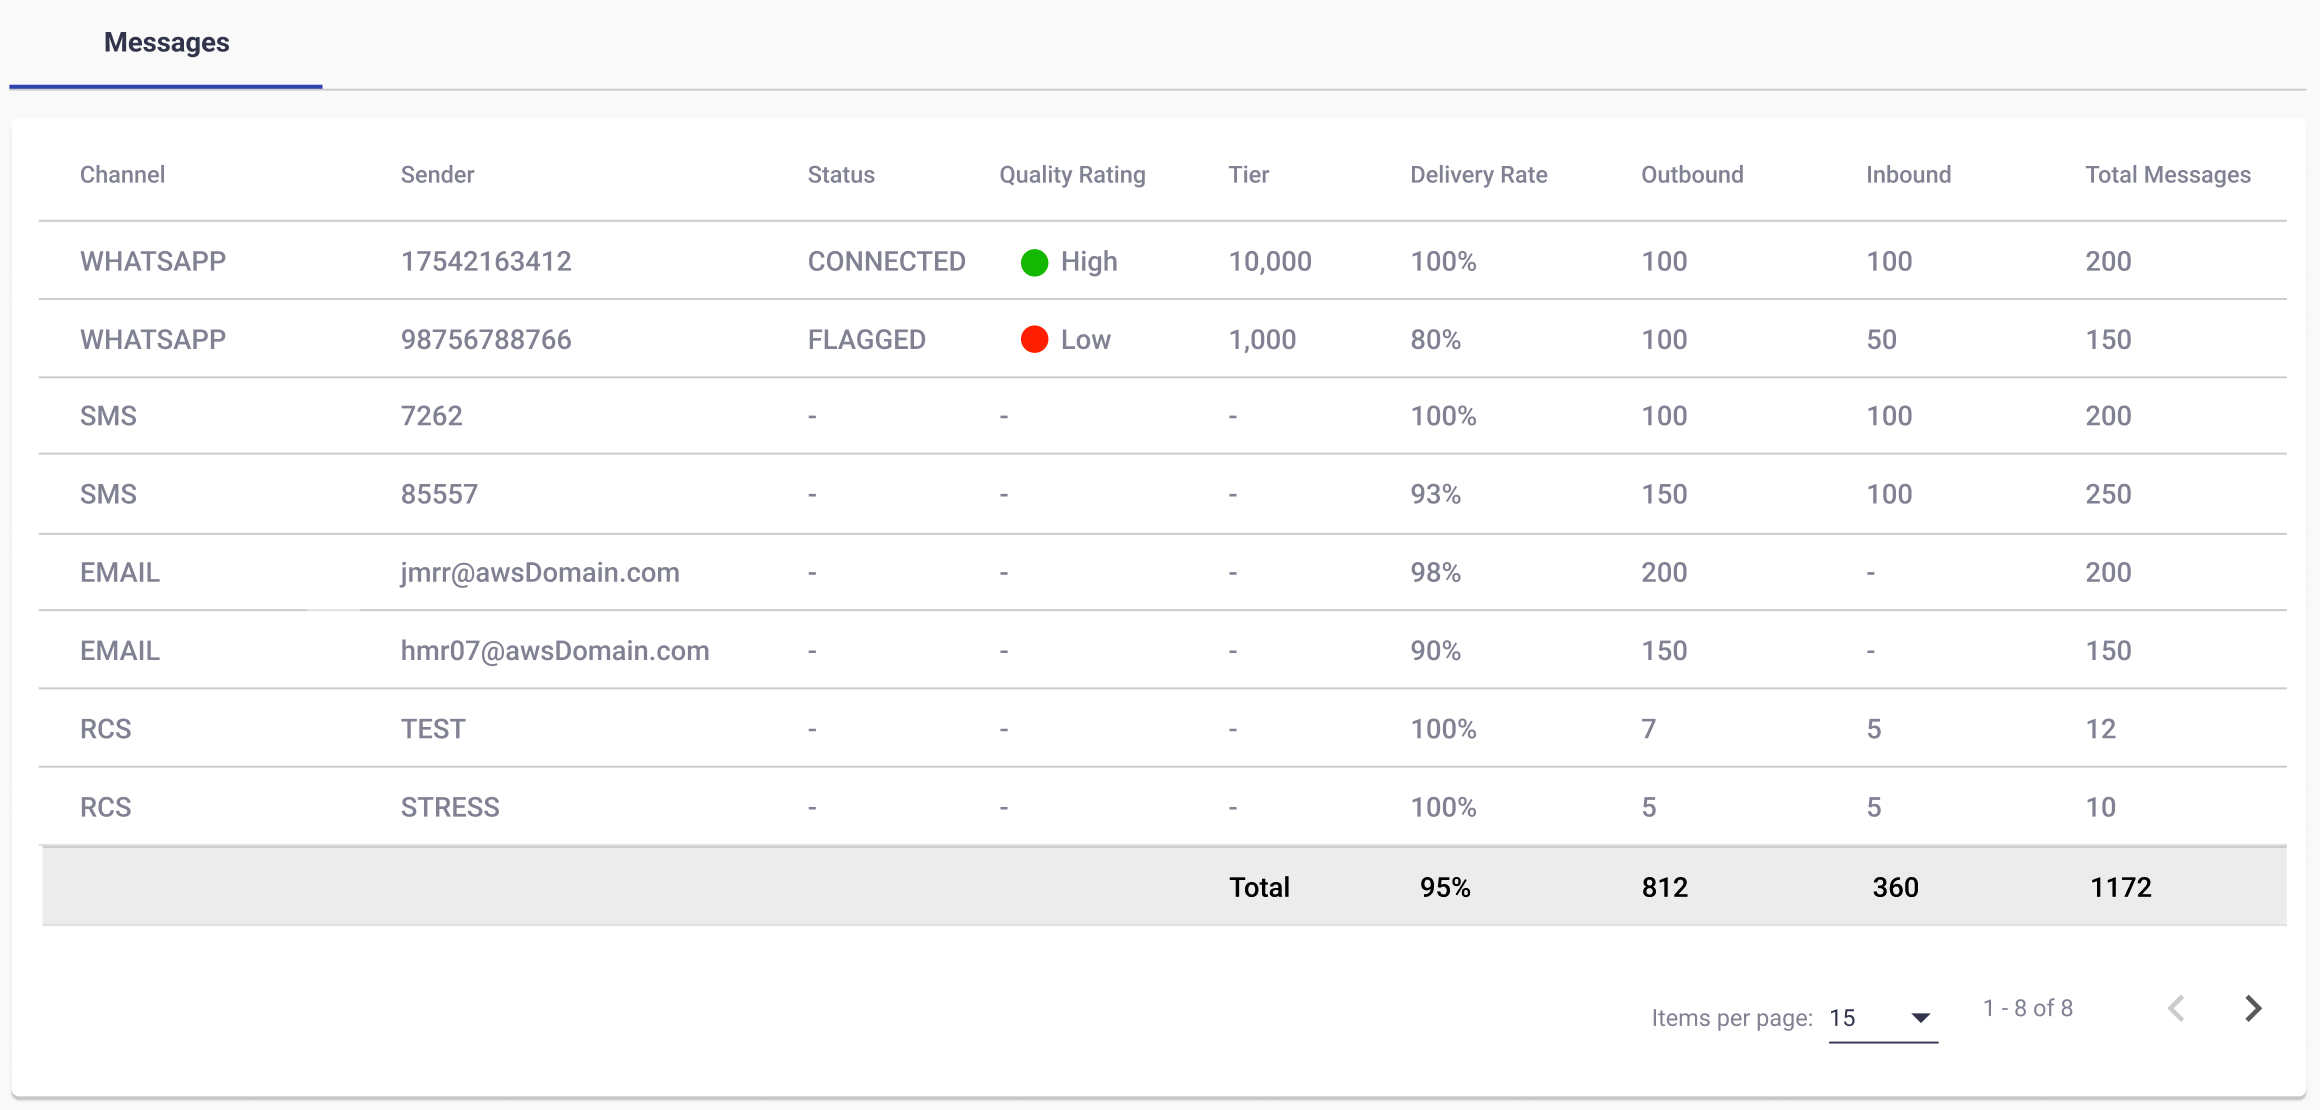
The table consists of the following columns:
| Columns | Description |
|---|---|
| Channel | Indicates the delivery channel (e.g., SMS, Email, WhatsApp, RCS) used by the sender to send or receive messages. |
| Sender | Delivery channel sending identity. |
| Status | Indicates the current connectivity state of the sender with the platform. A status of CONNECTED means the sender is actively linked and able to send and receive messages. |
| Quality Rating | Reflects the performance level of the sender, based on user engagement and message quality as determined by Meta. A High rating suggests good message delivery performance and user experience. |
| Tier | Displays the messaging tier level assigned to the sender, which determines the maximum number of business-initiated conversations allowed per day. For example, a Tier value of 1,000 allows up to 1,000 customer-initiated conversations daily using approved message templates. |
| Outbound | Total number of messages sent from the platform according to its respective sender. The cumulative total for sent messages is obtained from the Grand Total "Outbound". |
| Inbound | Total number of messages received from the platform according to its respective sender. The cumulative total for received messages is obtained from the Grand Total "Inbound". |
| Total Messages | Total number of messages that have been sent (outbound) and received (inbound) with their respective sender. The cumulative total for sent and received messages is obtained from the Grand Total "Outbound". |
| Delivery Rate |
|
The WhatsApp Sender Quality Rating & Status section covers Tier levels, Quality Rating values, and Status definitions.
NOTEIf a WhatsApp sender has been deactivated or permanently removed from the space, any message data associated with that sender will no longer be retrievable. This means that historical metrics such as Delivery Rate, Outbound, Inbound, and Total Messages will not be displayed in the table.
Even when applying filters by date range corresponding to the sender's active period, the platform will not display any messaging records linked to a sender that is no longer available.
To preserve continuity in reporting and historical analysis, it is recommended to export relevant data before a sender is decommissioned or removed from service.
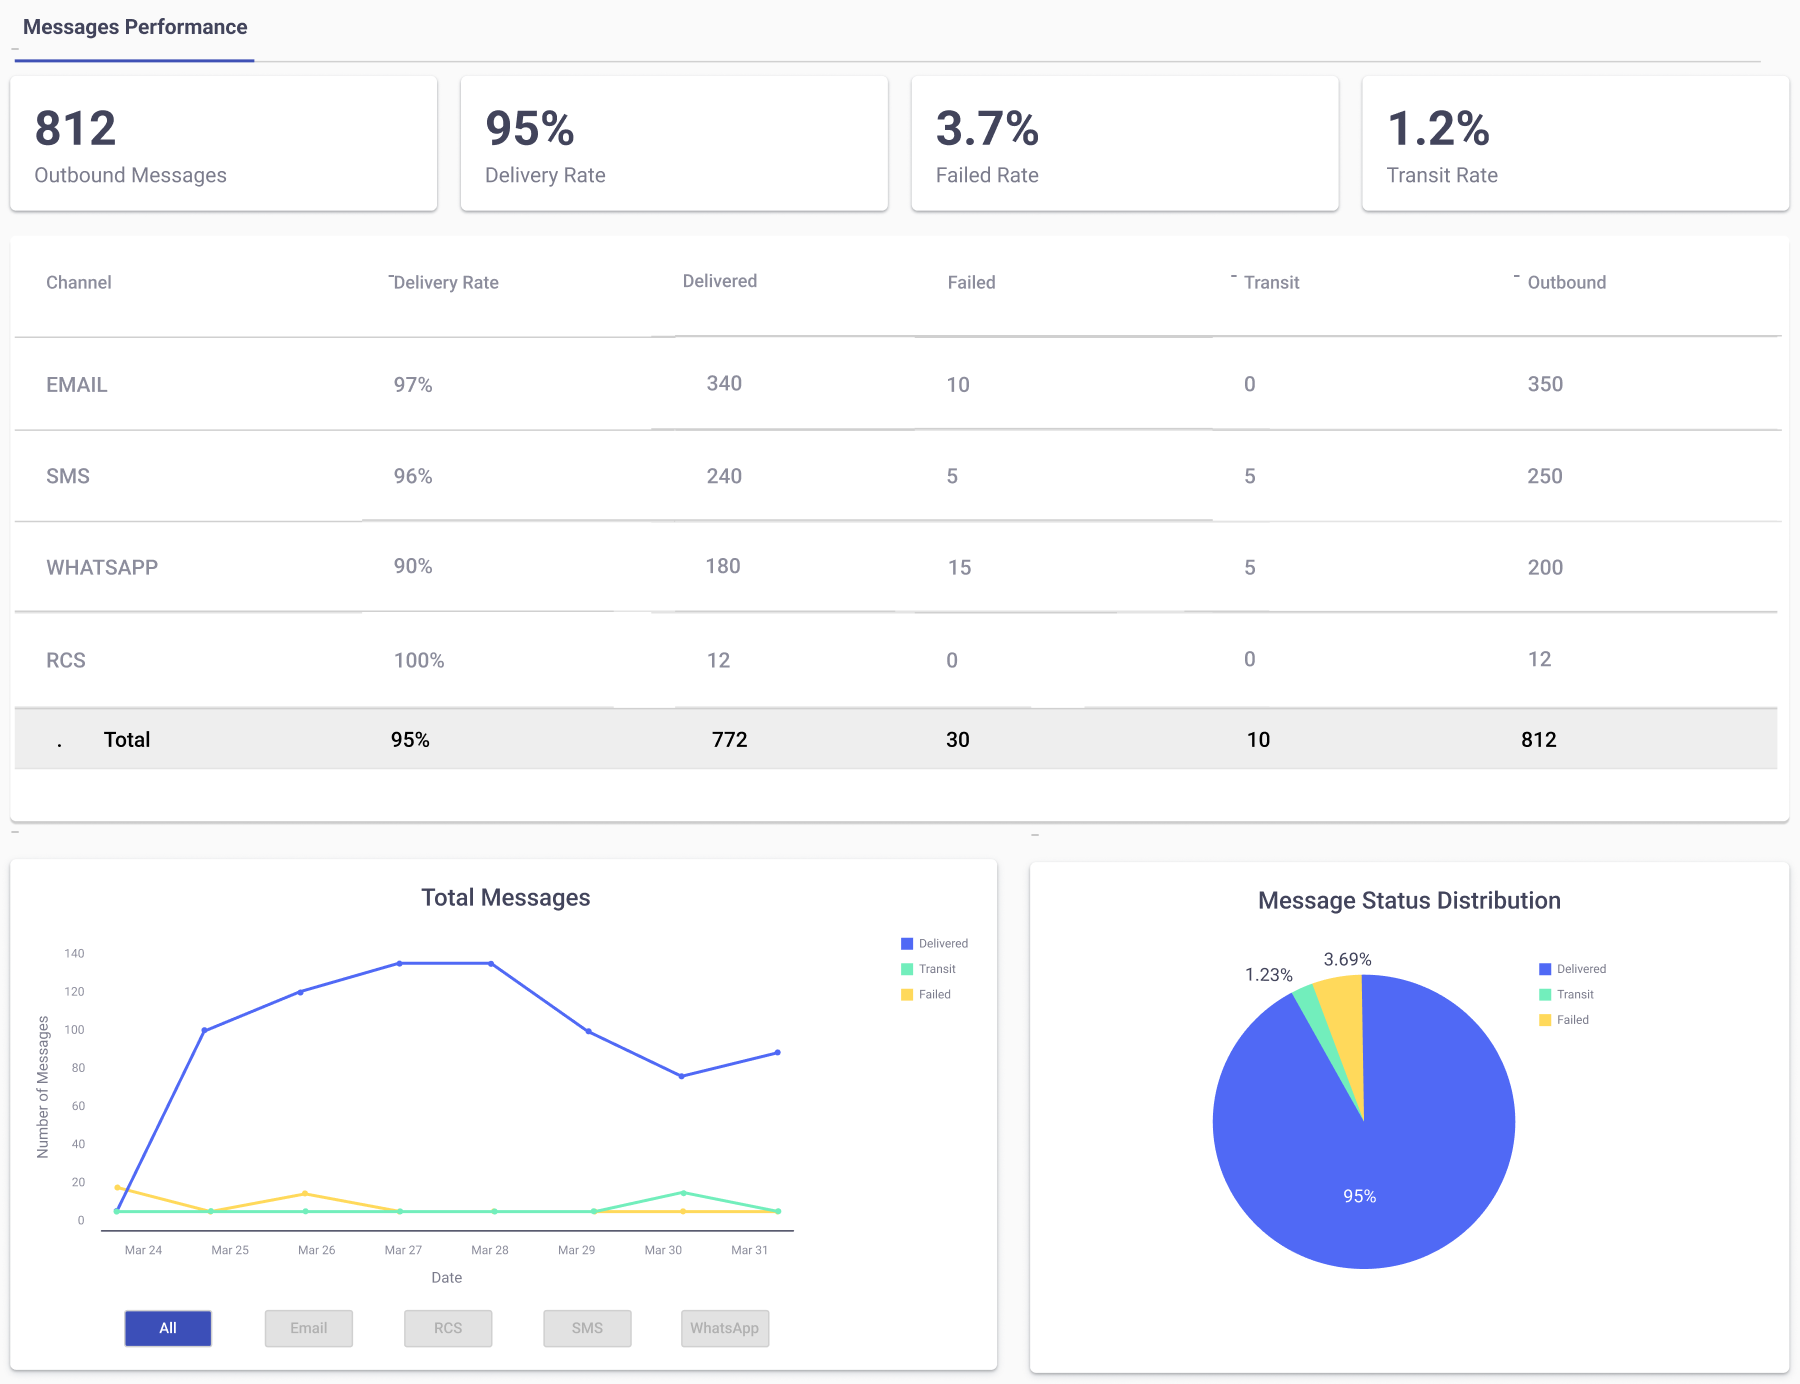
Messages Performance tab
The Messages Performance tab provides a detailed visualization and analysis of message delivery outcomes across all delivery channels (SMS, Email, WhatsApp, RCS). It helps you monitor performance metrics, identify delivery issues, and evaluate overall messaging effectiveness.
The tab includes three main components:
- KPI Summary (Key Performance Indicators)
- Performance Table
- Data Visualization Graphs
The KPIs located at the top of the Messages Performance tab are the following:

- Outbound Messages: Total number of messages sent through all channels combined.
- Delivery Rate: Percentage of outbound messages that were successfully delivered.
- Failed Rate: Percentage of messages that failed before reaching the recipient.
- Transit Rate: Percentage of messages still pending a final delivery status (e.g., in queue, no coverage, etc.)
The performance table appears directly below the KPIs. It breaks down metrics per delivery channel.
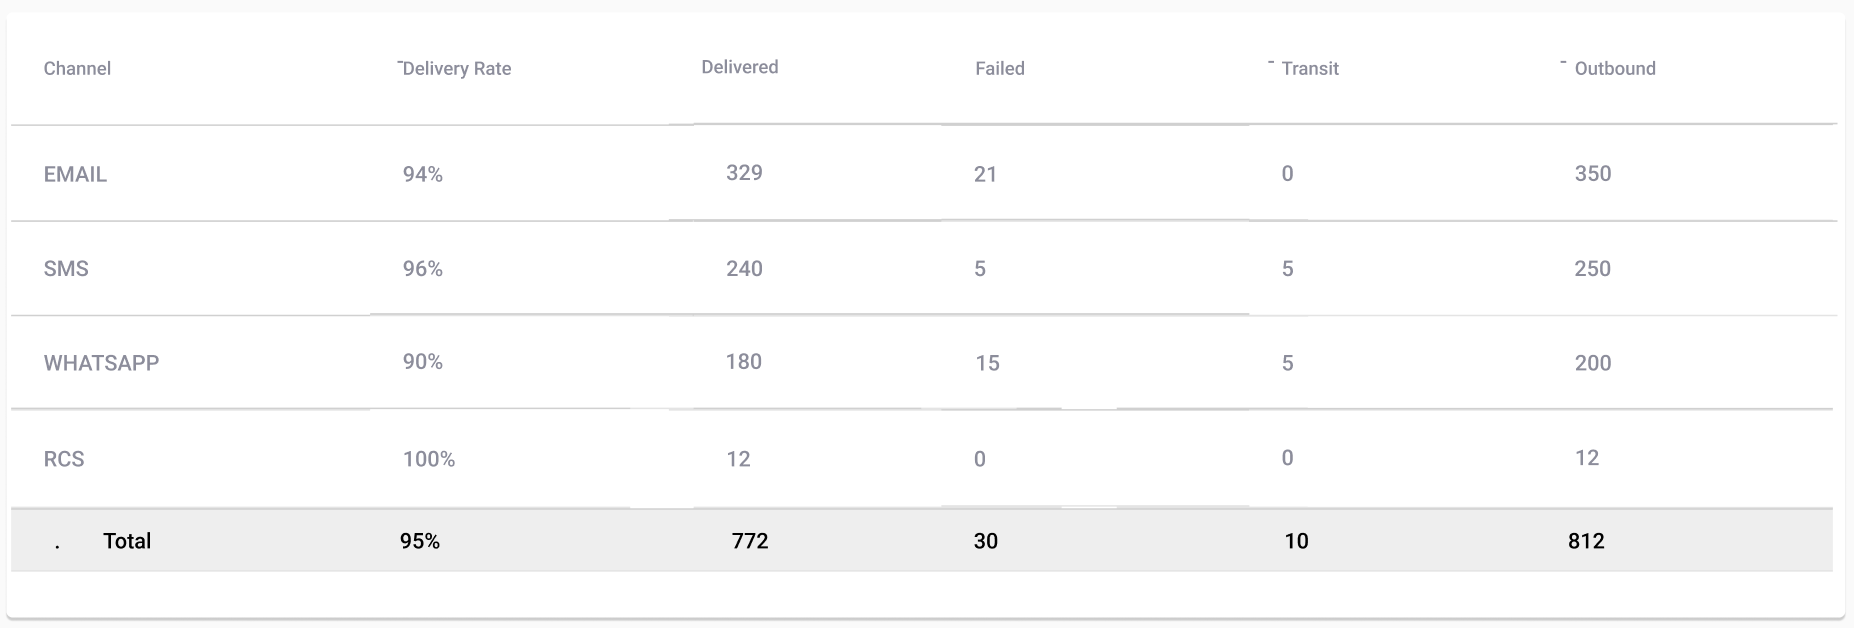
The table consists of the following columns:
| Columns | Description |
|---|---|
| Channel | Type of delivery channel. |
| Delivery Rate | Percentage of the total messages that have been successfully delivered.
|
| Delivered | Total number of messages that have been successfully delivered. The cumulative total for sent messages is obtained from the Grand Total "Delivered". |
| Failed | Total number of messages that were reported as failed before being delivered. The cumulative total for failed messages is obtained from the Grand Total "Failed". |
| Transit | Total number of messages still pending a final delivery status (e.g., in queue, no coverage, etc.) The cumulative total for transit messages is obtained from the Grand Total "Transit". |
| Outbound | Total number of outbound messages sent. The cumulative total for sent messages is obtained from the Grand Total "Outbound". |
Below the performance table, two graphs provide visual insight into messaging activity and performance:
-
Total Messages by Status & Channel: Displays a timeline of outbound, delivered, transit, and failed messages over the selected date range by delivery channel.
Each message status is identified by a color code legend as shown on the top right corner of the graph.
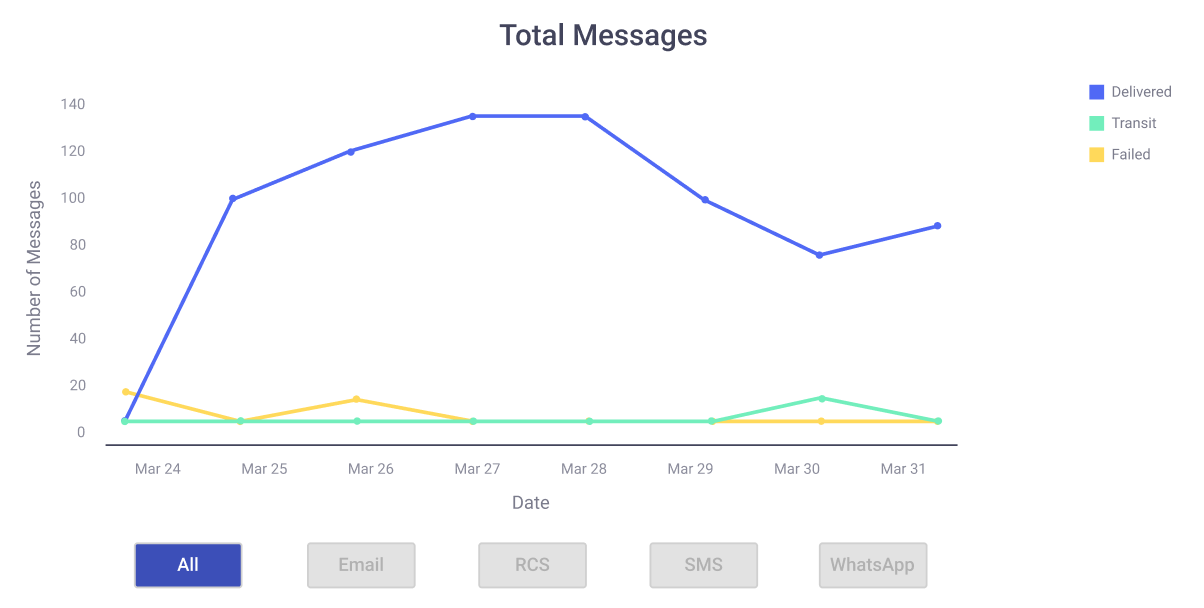
By default, the graph displays all delivery channels and statuses. You click a channel to filter it. You select a status on the color-coded legend to toggle it on or off.
The horizontal axis shows the date range and delivery channels. The vertical axis shows total messages per status on any given date.
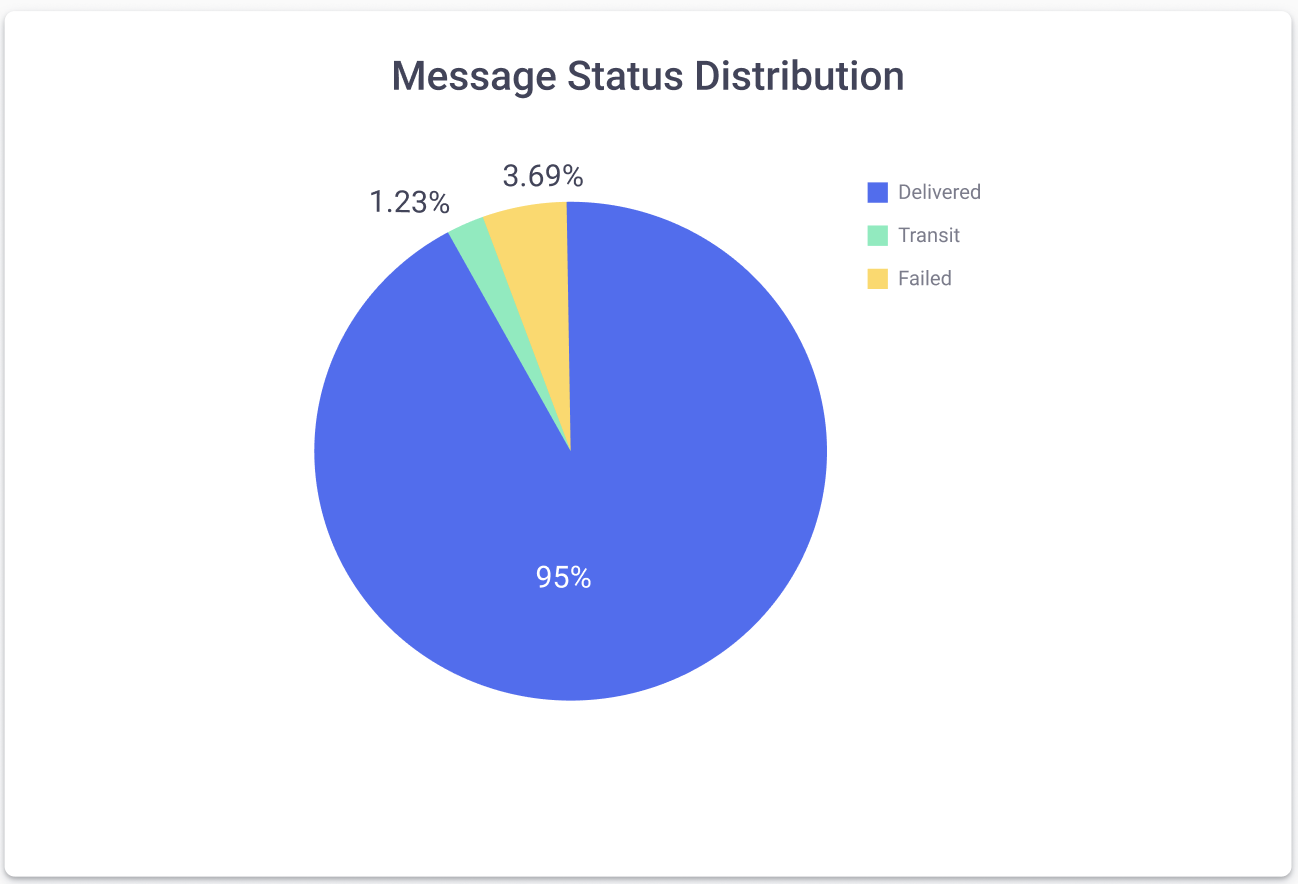
-
Message Status Distribution Pie Chart: This pie chart displays the overall percentage distribution of messages based on their status: Delivered, Transit, Failed.
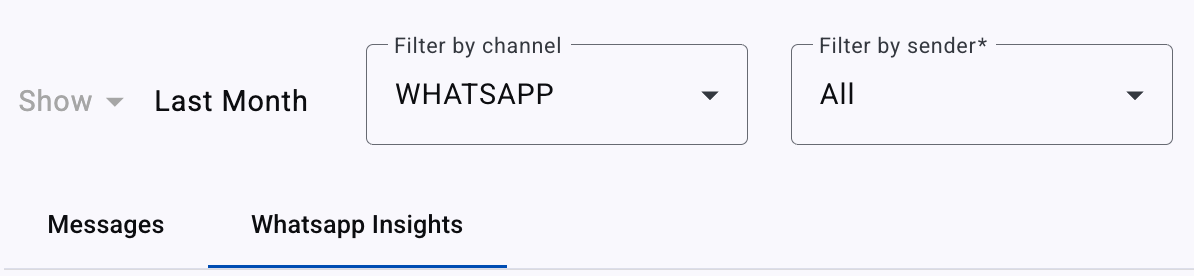
WhatsApp Insights tab
The WhatsApp Insights tab provides detailed insights into WhatsApp message metrics associated with the WhatsApp Business Account (WABA) used in the platform. To access this tab, you select the WhatsApp option from the Filter by Channel dropdown.
The WhatsApp Insights tab introduces an analytics & reporting view designed to visualize and export message volume and cost data associated with the WhatsApp numbers configured within the Space. You analyze traffic distribution, understand billing references, and access summarized or detailed insights by country.
WhatsApp messages are categorized into one of the following categories:
-
Authentication: Authenticates users with one-time passcodes, potentially at multiple steps in the login process (e.g., account verification, account recovery, integrity challenges).
-
Marketing: Promotions, offers, informational updates, or invitations for customers to respond or take action.
-
Utility: Facilitates specific agreed-upon requests or transactions, including confirmations, updates, and post-purchase notifications.
-
Service: Groups all free-form messages exchanged within the 24-hour customer service window that are not tied to a specific template category. It reflects conversational traffic where the business responds to user-initiated inquiries.
The categories displayed in the analytics and reporting are dynamic. Only categories for which there is traffic and data available for the selected sender and date range will appear.
Additional categories such as Marketing Lite or International Authentication appear when applicable to specific countries or traffic conditions. If there is no traffic of that type, those categories will not be displayed.
At the top of the WhatsApp Insights tab, you filter by date range and WhatsApp sender. Selecting one or both of these filters will modify the data displayed in the table. The table includes key operational and financial indicators for each WhatsApp number (sender).
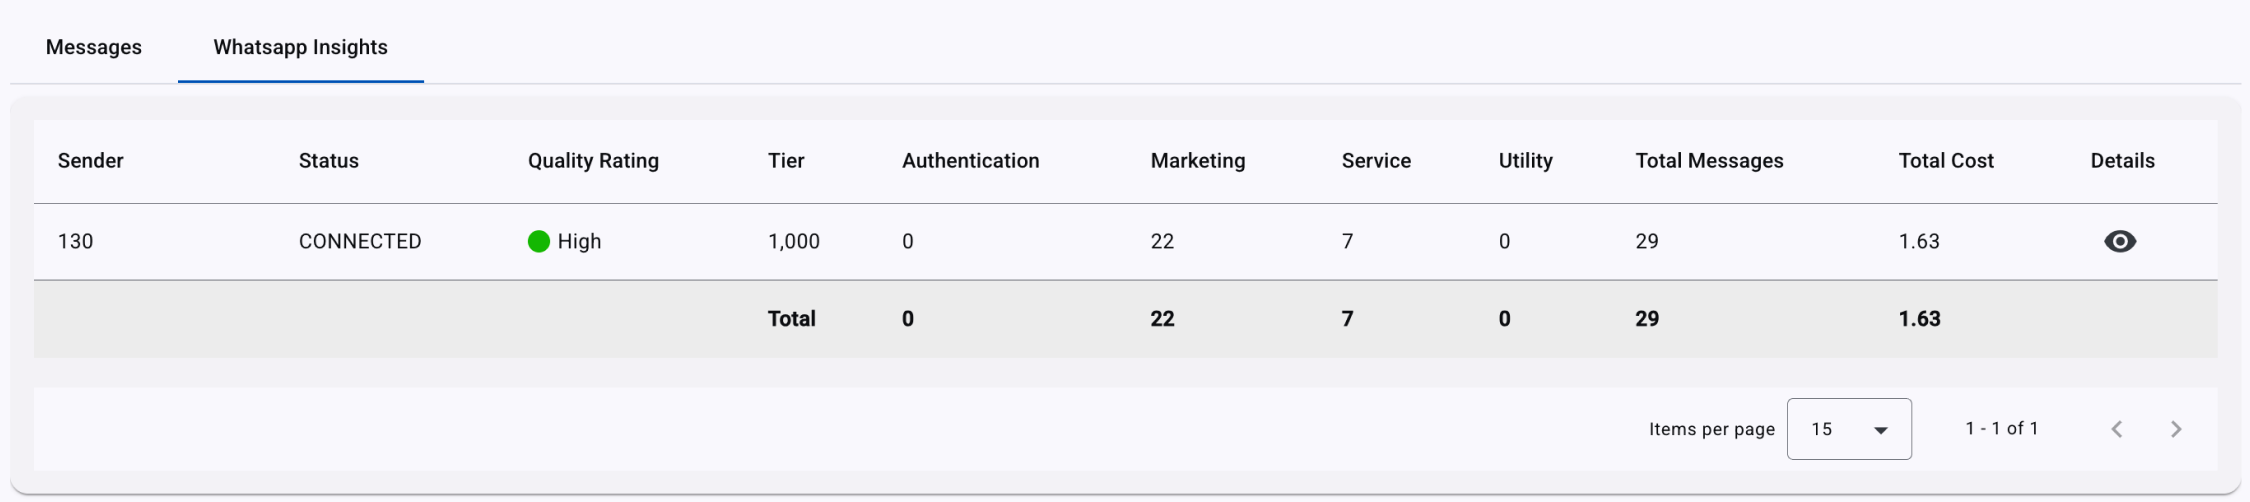
The columns displayed in the table are the following:
-
Sender: WhatsApp sending identity (sender).
-
Status: Indicates the current connectivity state of the sender with the platform. A status of CONNECTED means the sender is actively linked and able to send and receive messages.
The Status Definitions section covers WhatsApp Sender status details.
-
Quality Rating: Reflects the performance level of the sender, based on user engagement and message quality as determined by Meta. A High rating suggests good message delivery performance and user experience.
-
Tier: Displays the messaging tier level assigned to the sender, which determines the maximum number of business-initiated conversations allowed per day. For example, a Tier value of 1,000 allows up to 1,000 customer-initiated conversations daily using approved message templates.
-
Authentication, Marketing, Utility, Service: Shows the number of messages sent per category, based on Meta's classification of conversations and message templates.
-
Total Messages: Sum of all message categories during the selected date range for each WhatsApp number (sender).
-
Total Cost: Total estimated cost of messages during the selected date range, expressed in USD or local currency (depending on Meta's data).
Reference ValuesThe information shown in the analytics and reporting — including message counts and costs — is based on the data reported by Meta and is provided for informational and billing-reference purposes. Values may be updated if Meta adjusts its records, pricing, or billing logic.
-
Details: Provides access to a detailed view segmented by country.
After you select a specific sender from the summary table, the system displays a secondary table detailing message distribution and costs by destination country.

The view maintains the same column structure and includes the following additional parameter:
- Country: Indicates the destination country of the messages.
The data shows how message volumes and estimated costs are distributed across geographic regions.
The WhatsApp Sender Quality Rating & Status section covers Tier levels, Quality Rating values, and Status definitions.
Exporting the analytics and reporting (CSV)
The WhatsApp Insights (Full) export delivers a CSV file with WhatsApp volume and cost data. It includes daily breakdowns by sender, country, and pricing category. Users with the required permissions export the WhatsApp Insights analytics and reporting as a CSV file.
How Export Works:
-
The export option is available through the Export Report button located in the upper right corner.
-
Once the Export Report button is clicked, choose WhatsApp Insights under Download report by.

-
Confirm the Email address where you want to receive the file. Click Ok to start the export.
-
Upon request, the system generates the analytics and reporting and sends it automatically to the requester's email address.
- The CSV file includes both paid and free messages, reflecting the raw data provided by Meta, and is detailed daily.
- Dates are displayed using Coordinated Universal Time (UTC) rather than UNIX timestamps.
- Phone numbers are displayed as plain numeric values, without any additional formatting.
The export supports external analysis, auditing, and integration with analytics and reporting tools. It is designed for billing, reconciliation with Meta, and external analytics.
Each row in this file represents the volume and cost of messages for a single day, for a specific combination of:
- WhatsApp number (sender)
- Destination country
- Pricing category
- Pricing type (free vs. paid)
The WhatsApp Insights (Full) CSV includes the following columns:

-
start_date & end_date: 24-hour window for that row. For daily exports, end_date is the day immediately following start_date. Dates are aligned with Meta's reporting and are in UTC (Coordinated Universal Time).
-
number: WhatsApp phone number (sender) in E.164 format.
-
country: Destination country of the messages. It is expressed as an ISO country code.
-
category: Meta pricing category for the traffic. The categories are dynamic and only appear when there is traffic for that type during the selected date range. If there is no traffic for a given category in the selected period, that category won't appear in any row.
-
type: Pricing type returned by Meta for that traffic. The most common values are:
-
FREE_CUSTOMER_SERVICE: Free customer service messages within the 24-hour window.
-
REGULAR: Paid traffic for that category.
-
-
volume: Total number of WhatsApp messages. It counts how many messages were sent for that specific day, WhatsApp number, destination country, pricing category, and pricing type. Volume represents the count of messages sent on that day for that specific combination of number, country, category, and type.
-
cost: Total estimated cost for the messages in that row, expressed in USD or local currency, according to Meta's data.
Considerations
When using the WhatsApp Insights analytics and reporting, users must consider the following:
- Time Zone: Meta does not manage time zones. All timestamps are displayed in UTC.
- Data Availability: Meta may impose limits on data access or restrict available date ranges.
- Reference Values: The message counts and costs are derived from Meta's data and are intended as informative indicators for analysis and billing reference. They may change if Meta updates its underlying data or pricing.
NOTEIf a WhatsApp sender has been deactivated or permanently removed from the space, any message data associated with that sender will no longer be retrievable. This means that historical metrics such as Delivery Rate, Outbound, Inbound, and Total Messages will not be displayed in the table.
Even when applying filters by date range corresponding to the sender's active period, the platform will not display any messaging records linked to a sender that is no longer available.
To preserve continuity in reporting and historical analysis, it is recommended to export relevant data before a sender is decommissioned or removed from service.
Updated 21 days ago