Web Trivia
The Web Trivia campaign report provides a comprehensive and segmented view of campaign performance, audience engagement, and prize distribution. This report is structured into seven informative tabs, each designed to help users analyze different aspects of their campaign with clarity and precision.
Here’s a summary of what each tab includes:
- Performance: Provides a visual overview of the user journey, tracking how recipients progress through the different engagement stages of the Web Trivia campaign.
- Questions and Answers: Presents detailed information on user responses to each trivia question, including total participations, correct and incorrect answer distribution, and answer rates per choice.
- Campaign Overview: Summarizes the main configuration of the campaign.
- Participants: Lists all users who engaged with the campaign, showing individual activity, participation status, and the option to re-engage participants directly from the report. This tab also provides filtering, searching, and winner selection features.
- Trivia Prizes: Tracks prize availability, quantity distributed, and logs all winners.
- Link Tracking: Offers analytics on link interaction, including a geographic heatmap, OS distribution, total clicks, and unique clicks.
- Interaction Events: Visualizes participant actions on a timeline, helping you understand when campaign engagement occurred by showing the volume of events triggered per day.
KPIs
At the top of the report interface, three key metrics are displayed:

- Opened URL Link: Total number of unique clicks that the ShortURL of the interactive campaign has received from the end users. The action is logged when the user clicks on the ShortURL of the interactive campaign.
- Played Interactive Content: Shows how many unique recipients interacted with the dynamic content of the campaign (when the end user has clicked on the Start button to begin the Trivia).
- Assigned Prizes: Indicates the number of prizes that have been assigned to participants.
Delivery tab
This tab presents the Messages by Status chart, which helps you assess the delivery flow of the campaign.
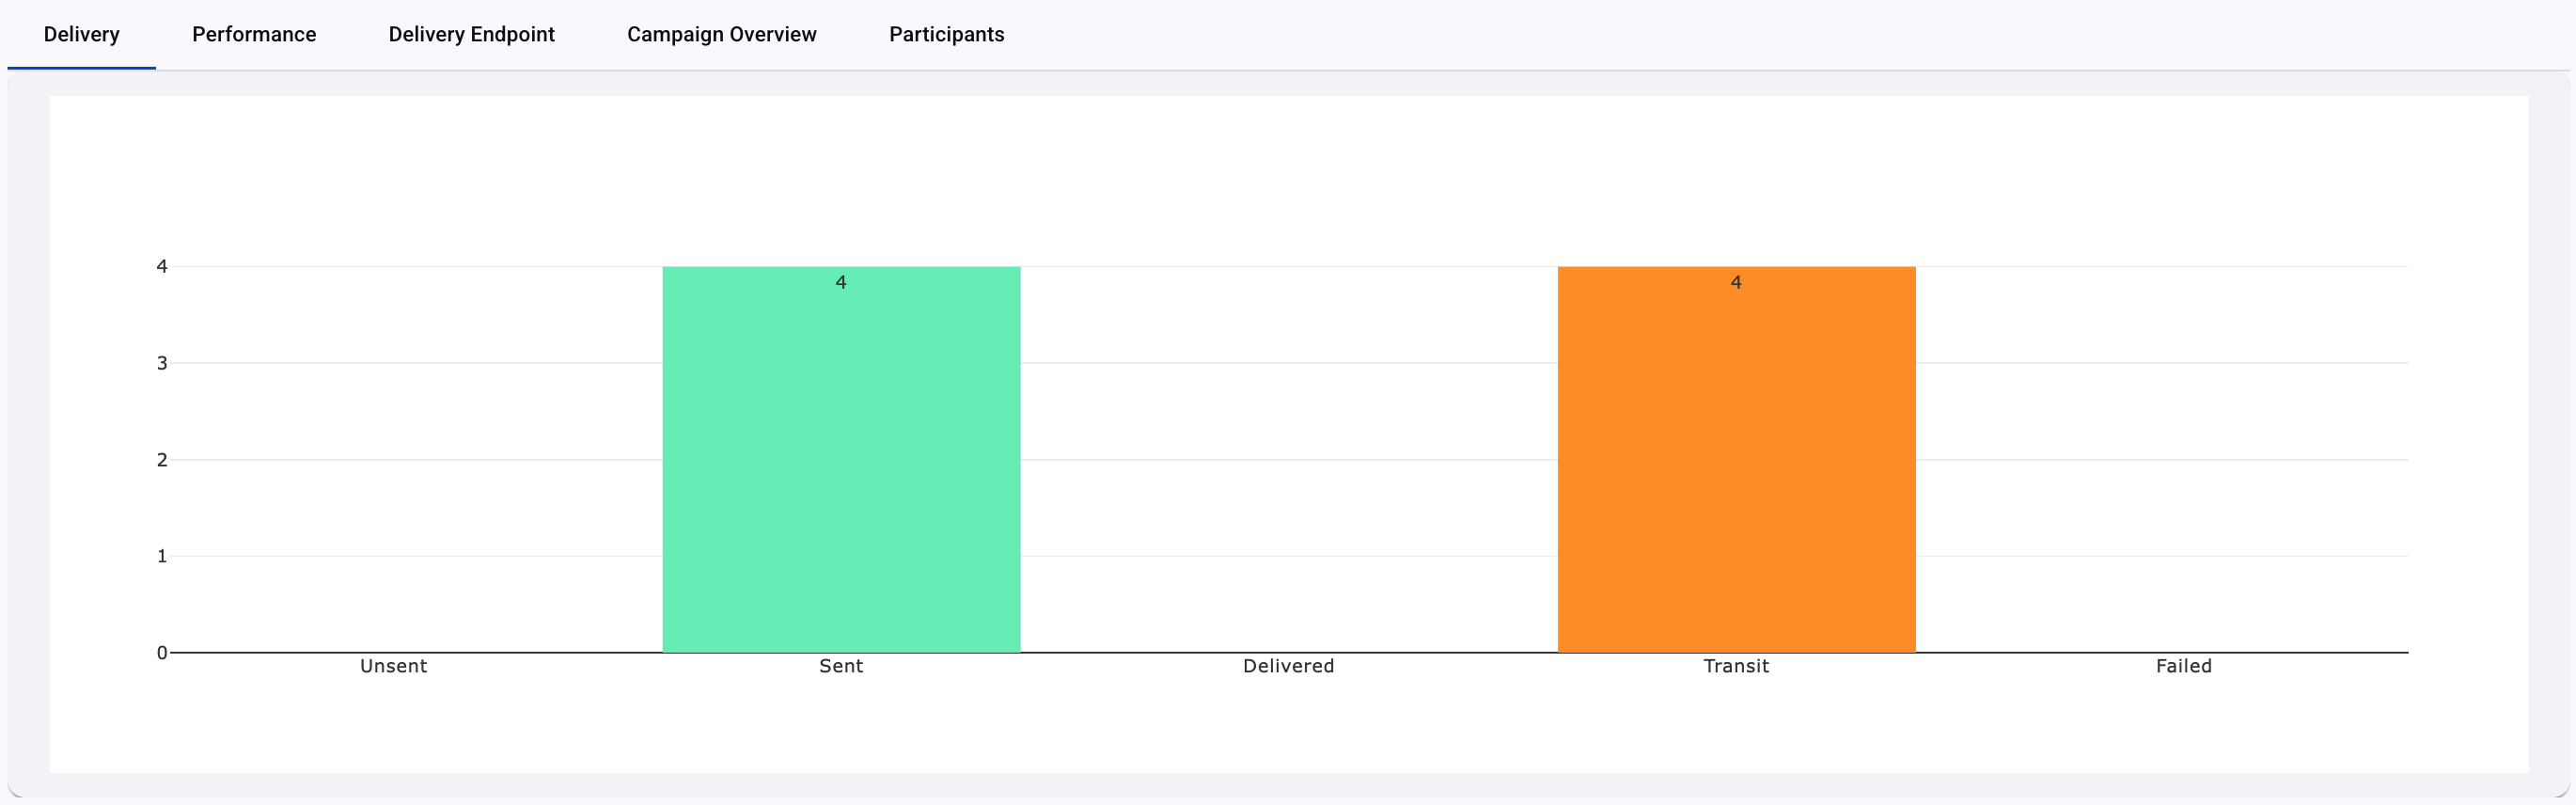
The chart dynamically adapts based on the channel used for delivery (SMS,Email, WhatsApp).
To understand the meaning and logic behind each status, refer to the specific documentation for each delivery channel.
Performance tab
The Performance tab provides a visual overview of the user journey, tracking how recipients progress through the different engagement stages of the Web Trivia campaign.
This section is presented in a funnel chart format, offering a quick and intuitive representation of audience retention throughout the interaction.
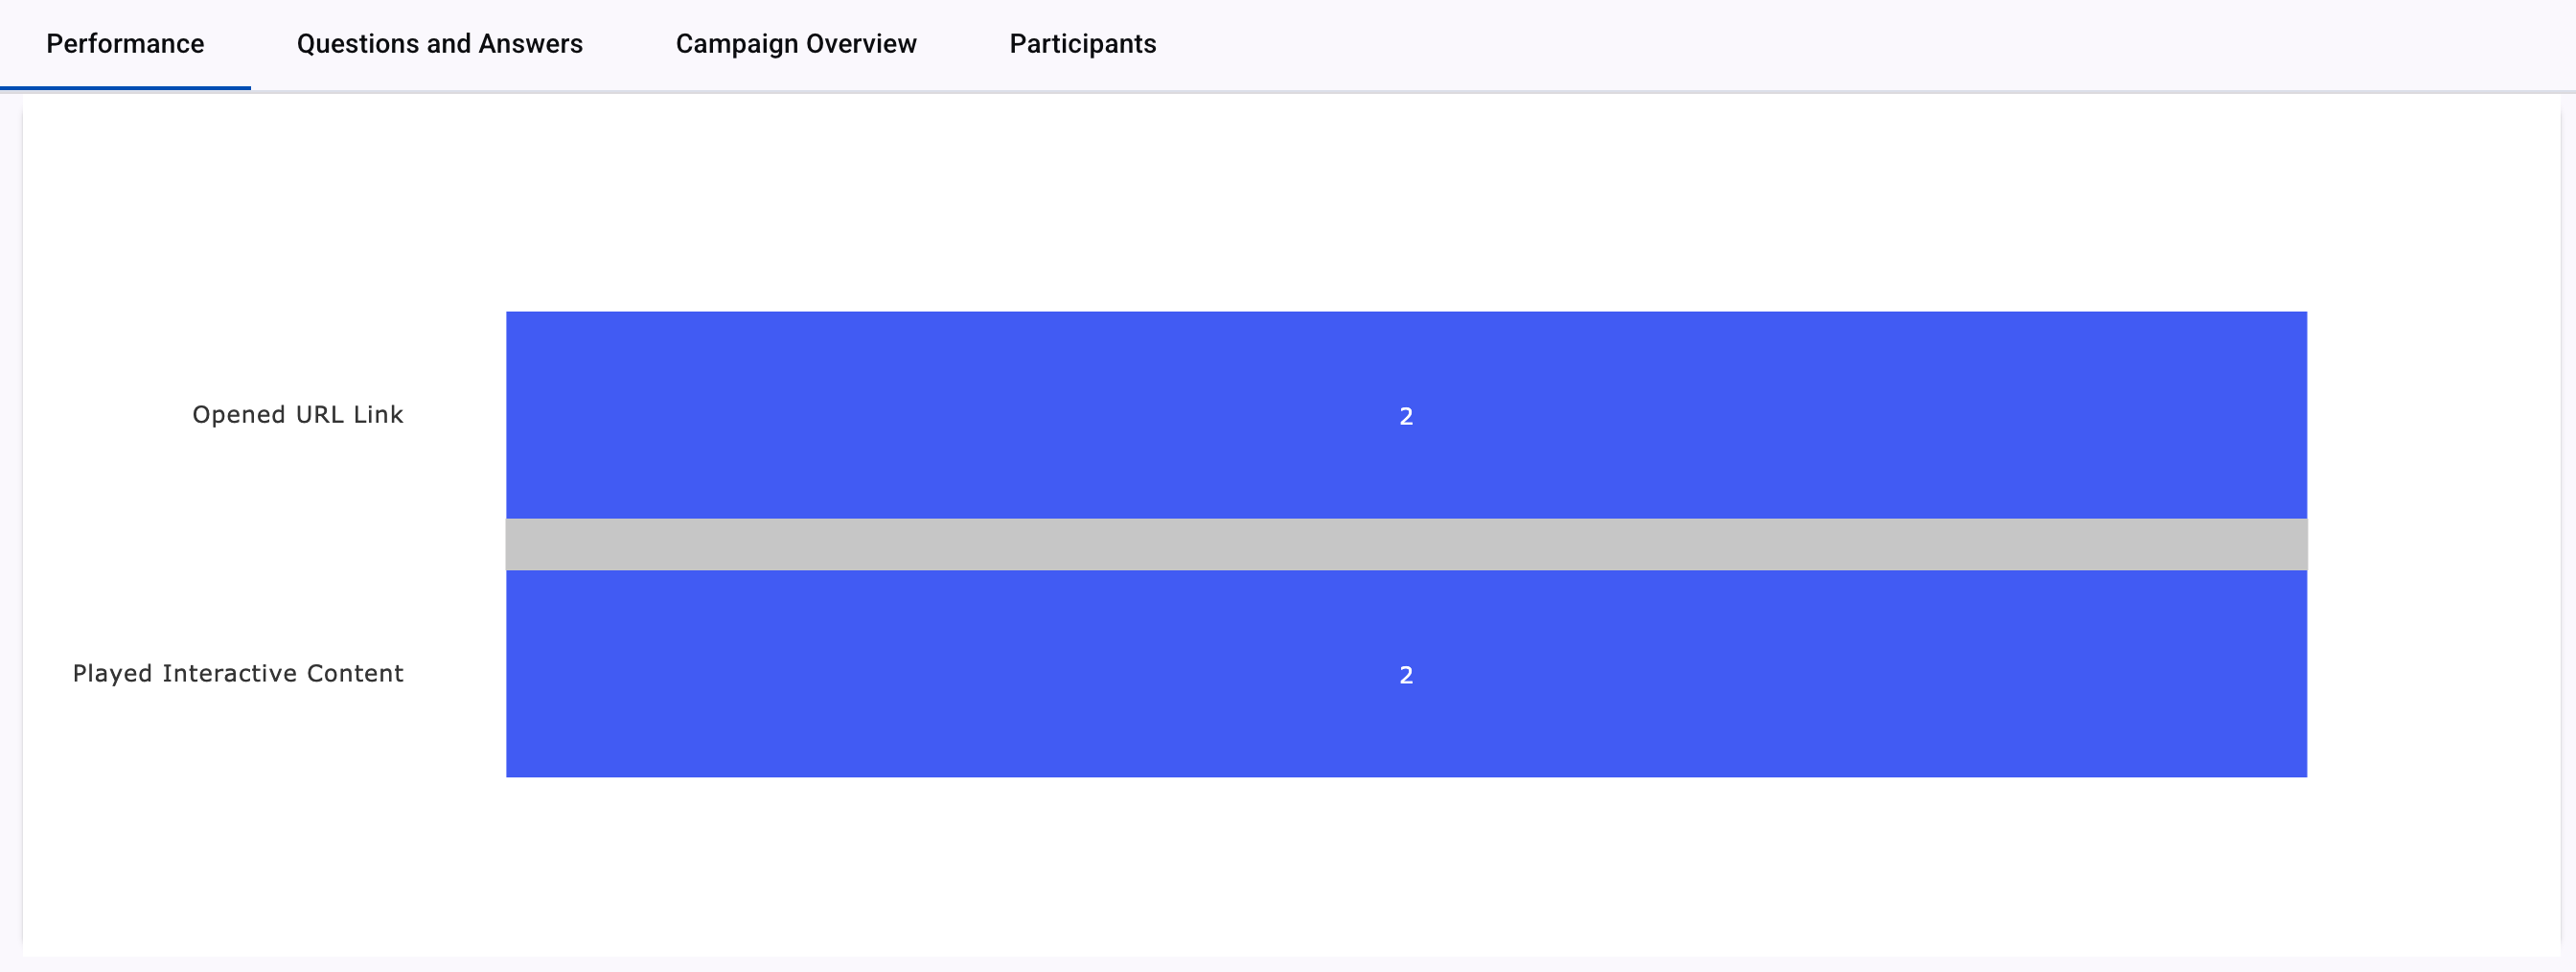
- Opened URL Link: Total number of unique clicks that the ShortURL of the interactive campaign has received from the end users. The action is logged when the user clicks on the ShortURL of the interactive campaign.
- Played Interactive Content: Shows how many unique recipients interacted with the dynamic content of the campaign (when the end user has clicked on the Start button to begin the Trivia).
Questions & Answers tab
The Questions and Answers tab in the Trivia campaign report is designed to provide in-depth insights into participant performance and engagement at the question level.
KPIs
At the top of the tab, you’ll find the KPIs that reflect participant behavior and interaction patterns:

- Total Unique Participants: Displays the number of distinct users who engaged with the Trivia campaign at least once. Each user is only counted once, regardless of how many times they participated.
- Total Cumulative Participations: Reflects the total number of interactions recorded, including repeated attempts by the same user. This helps assess the overall activity volume.
- Total Questions: Indicates the number of questions configured for the campaign. It sets the reference point for evaluating answer distributions and user completion rates.
Total Cumulative Answers Distribution
This section presents a tabular summary of the total correct and incorrect answers submitted across all trivia questions. It includes:

- Question number and label
- Correct Answers: The count of responses that matched the configured correct answer.
- Wrong Answers: The count of all incorrect responses.
Alongside the table, a circular (pie) chart visually represents the distribution of right versus wrong answers as a percentage, allowing for a quick and intuitive understanding of overall user performance.
Question Review Section
This area offers a detailed, question-by-question breakdown using three complementary views:

- Answers Distribution Graph: The Answers Distribution graph visualizes how participants responded to a specific trivia question. Each colored horizontal bar represents one of the four answer options, with the length of the bar indicating the total number of responses received for that option. Each question is located at the top of the graph, and its options will be listed between the table and the graph.
- X-axis (horizontal): Shows the number of responses for each answer option.
- Y-axis (vertical): Represents each answer option from the question shown as horizontal bars in different colors.
- Response Table (Right Panel): The table provides an exact numeric and percentage breakdown of each answer option.
The table consists of the following columns:- Answer Choices: The label or text of the option that users can select when answering the question.
- Total Answers: The total number of responses this answer received.
- Answer Rate: The percentage (%) of total participants who chose this option.
- Total Cumulative Answers per Question Graph: Displays the percentage split between correct and wrong answers for the specific question. This allows a precise evaluation of how well users performed on each individual question.
Campaign Overview tab
This section outlines how the campaign was configured and how the trivia content appeared to the recipient
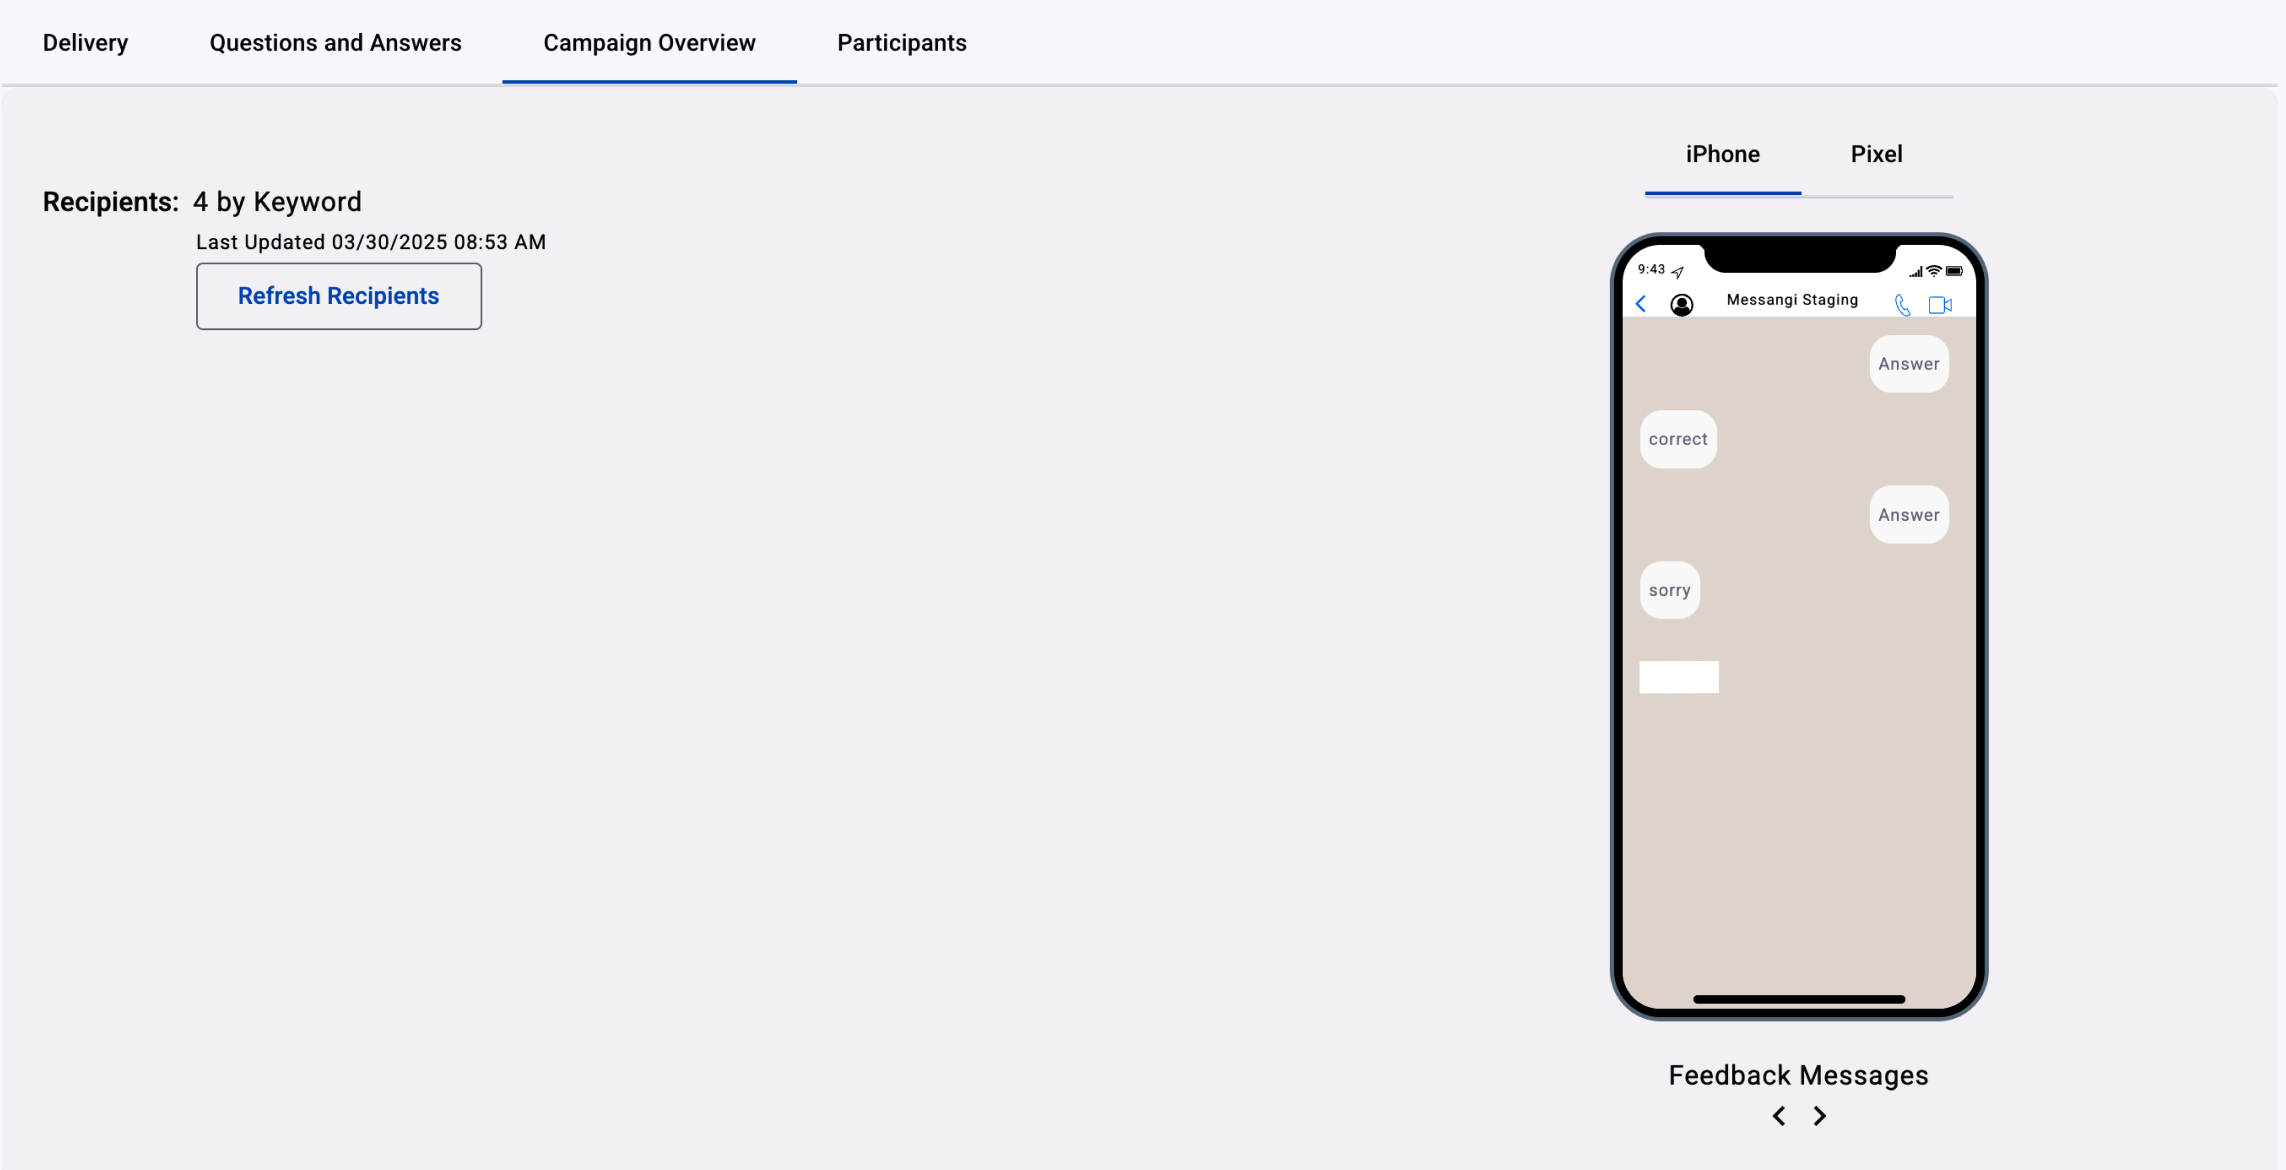
- Recipients: Indicates how the campaign audience was defined. In this case, the value “4 by Keyword” signifies that four users participated by interacting with a designated keyword trigger. The Refresh Recipients button allows you to manually update the recipient data in real-time reporting.
Participants tab
The Participants tab within the Interactive Campaigns Reports provides a detailed view of individual user engagement and participation throughout the campaign. This section helps you analyze how each user interacted with your campaign and supports audience segmentation based on their level of involvement. Additionally, it enables you to boost engagement by offering prize-based incentives through optional winner selection features available in most interactive campaigns.
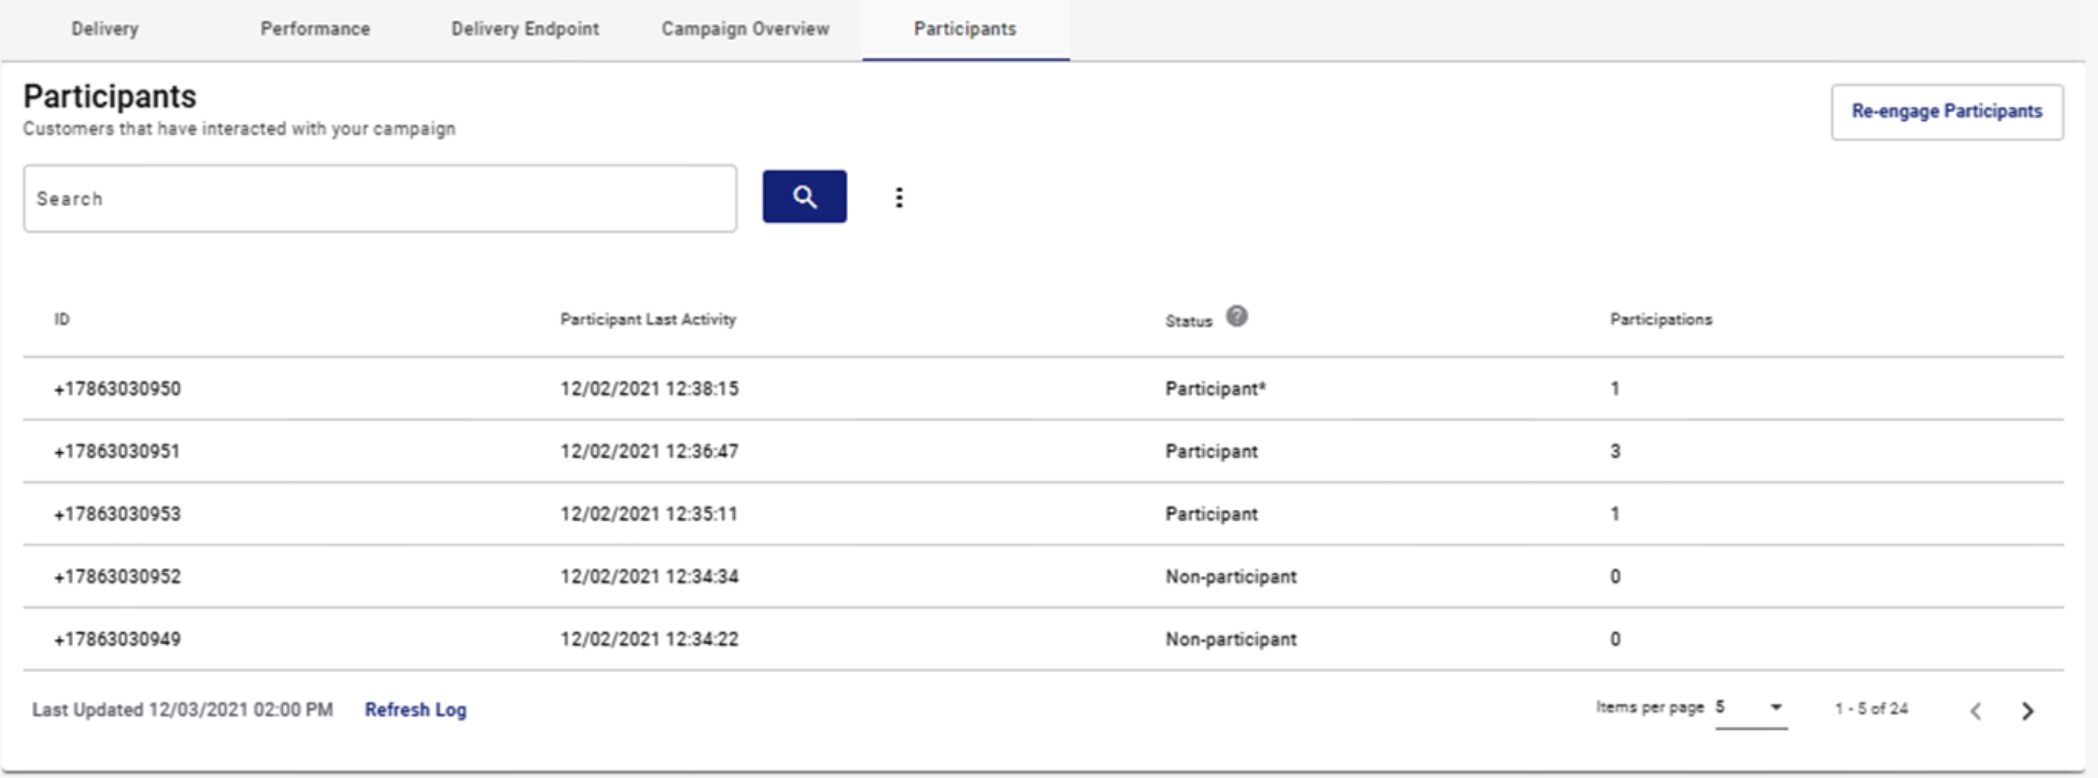
If you’d like to learn more about how to configure and use this feature, please refer to the Participants section of the documentation.
Trivia Prizes tab
The Trivia Prizes tab offers a comprehensive overview of all the prize-related activity within the trivia campaign. This section consolidates information about prize inventory, prize distribution, and end-user claim behavior, making it essential for tracking the effectiveness and fulfillment of incentive-based campaigns.

Prize Summary Table
The Prize Summary Table displays the full inventory of prizes configured during the campaign setup, along with the total number of prizes that have been generated and assigned to the end users who won the trivia.

Columns | Description |
|---|---|
Prize Name | The name assigned to the prize. |
Default Prize | If the user configured default prizes when setting the campaign prizes, when the remaining number of prizes is exhausted, this type of prize (Default Prize) will start to be assigned to end users infinitely as a consolation prize. Through a check mark, it will show you what the default prizes are. |
Prize Claimed | Total prizes that have been claimed once the end users click on the Claim button, as long as they were winners. |
Unclaimed Prizes | Total prizes that have not been claimed yet by the end users. |
Qty Remaining | Total number of prizes remaining to be assigned to the winning end users of the campaign. For example, the campaign generated 100 prizes. If 25 users played the trivia and were the winners, they will be considered "winners", therefore they will be assigned the prize. Now the counter of remaining prizes goes down to 75. |
Total Prize | Total number of prizes generated by the user configured. |
Prize Distribution
A pie chart that shows the percentage distribution of each type of prize assigned so far. This provides insight into how often each prize is being won.
Prizes Assigned by Day Graph
A time-based bar chart that tracks how many prizes were assigned each day. This is particularly helpful for identifying trends in user activity and prize assignment throughout the campaign's duration.
Winners Log
This table lists all users who have won and/or claimed a prize during the campaign. It allows for detailed tracking and exporting of prize assignments.

| Columns | Description |
|---|---|
| ID | Unique identifier of the end user. The ID is a phone number or email. |
| Prize Name | The name assigned to the prize. |
| Assign Date | Date (month, day, year, time) when the prize was assigned to the winning user. |
| Prize Claimed | This column allows you to know if the end user has claimed the prize or not. |
| Claim Date | Date (month, day, year, time) when the winning user claimed the prize. |
NOTEThe Winners Log table displays the user who has most recently won the prize or the user who most recently claimed the prize at the top of the table.
The Winners Log table provide you the following Actions:
-
Search Bar: Allows you to perform a search through the user's id.
-
Filter Prize: Allows you to filter through the prize name.
-
Sort: Apply a sort filter on the date the prize was assigned (Assign Date) , whether or not the prize was claimed (Prize Claimed), and the date the prize was claimed (Claim Date) by selecting the sort icon located next to the name column.

-
Export Report: Export a list of your winners and details with their respective information. That is, export the Winners Log table through a CSV file by selecting the Export button.
Once the button is selected, a Dialog will display to export the winners list as a .csv file and receive that list directly to your email.
 NOTE
NOTEIf you applied any type of filter (ID, prize name or sort) the csv file will be exported applying the filter.
-
Refresh Log: At the bottom section of the Participants table, you’ll find a timestamp of when the contents of the table was last updated, and selecting Refresh Log can update the table, as its contents are dynamic in nature and campaign participation is an ongoing activity to be continuously monitored and reported.
Link Tracking tab
The Link Tracking tab provides behavioral insights into user interaction with your Web Trivia interactive campaign.
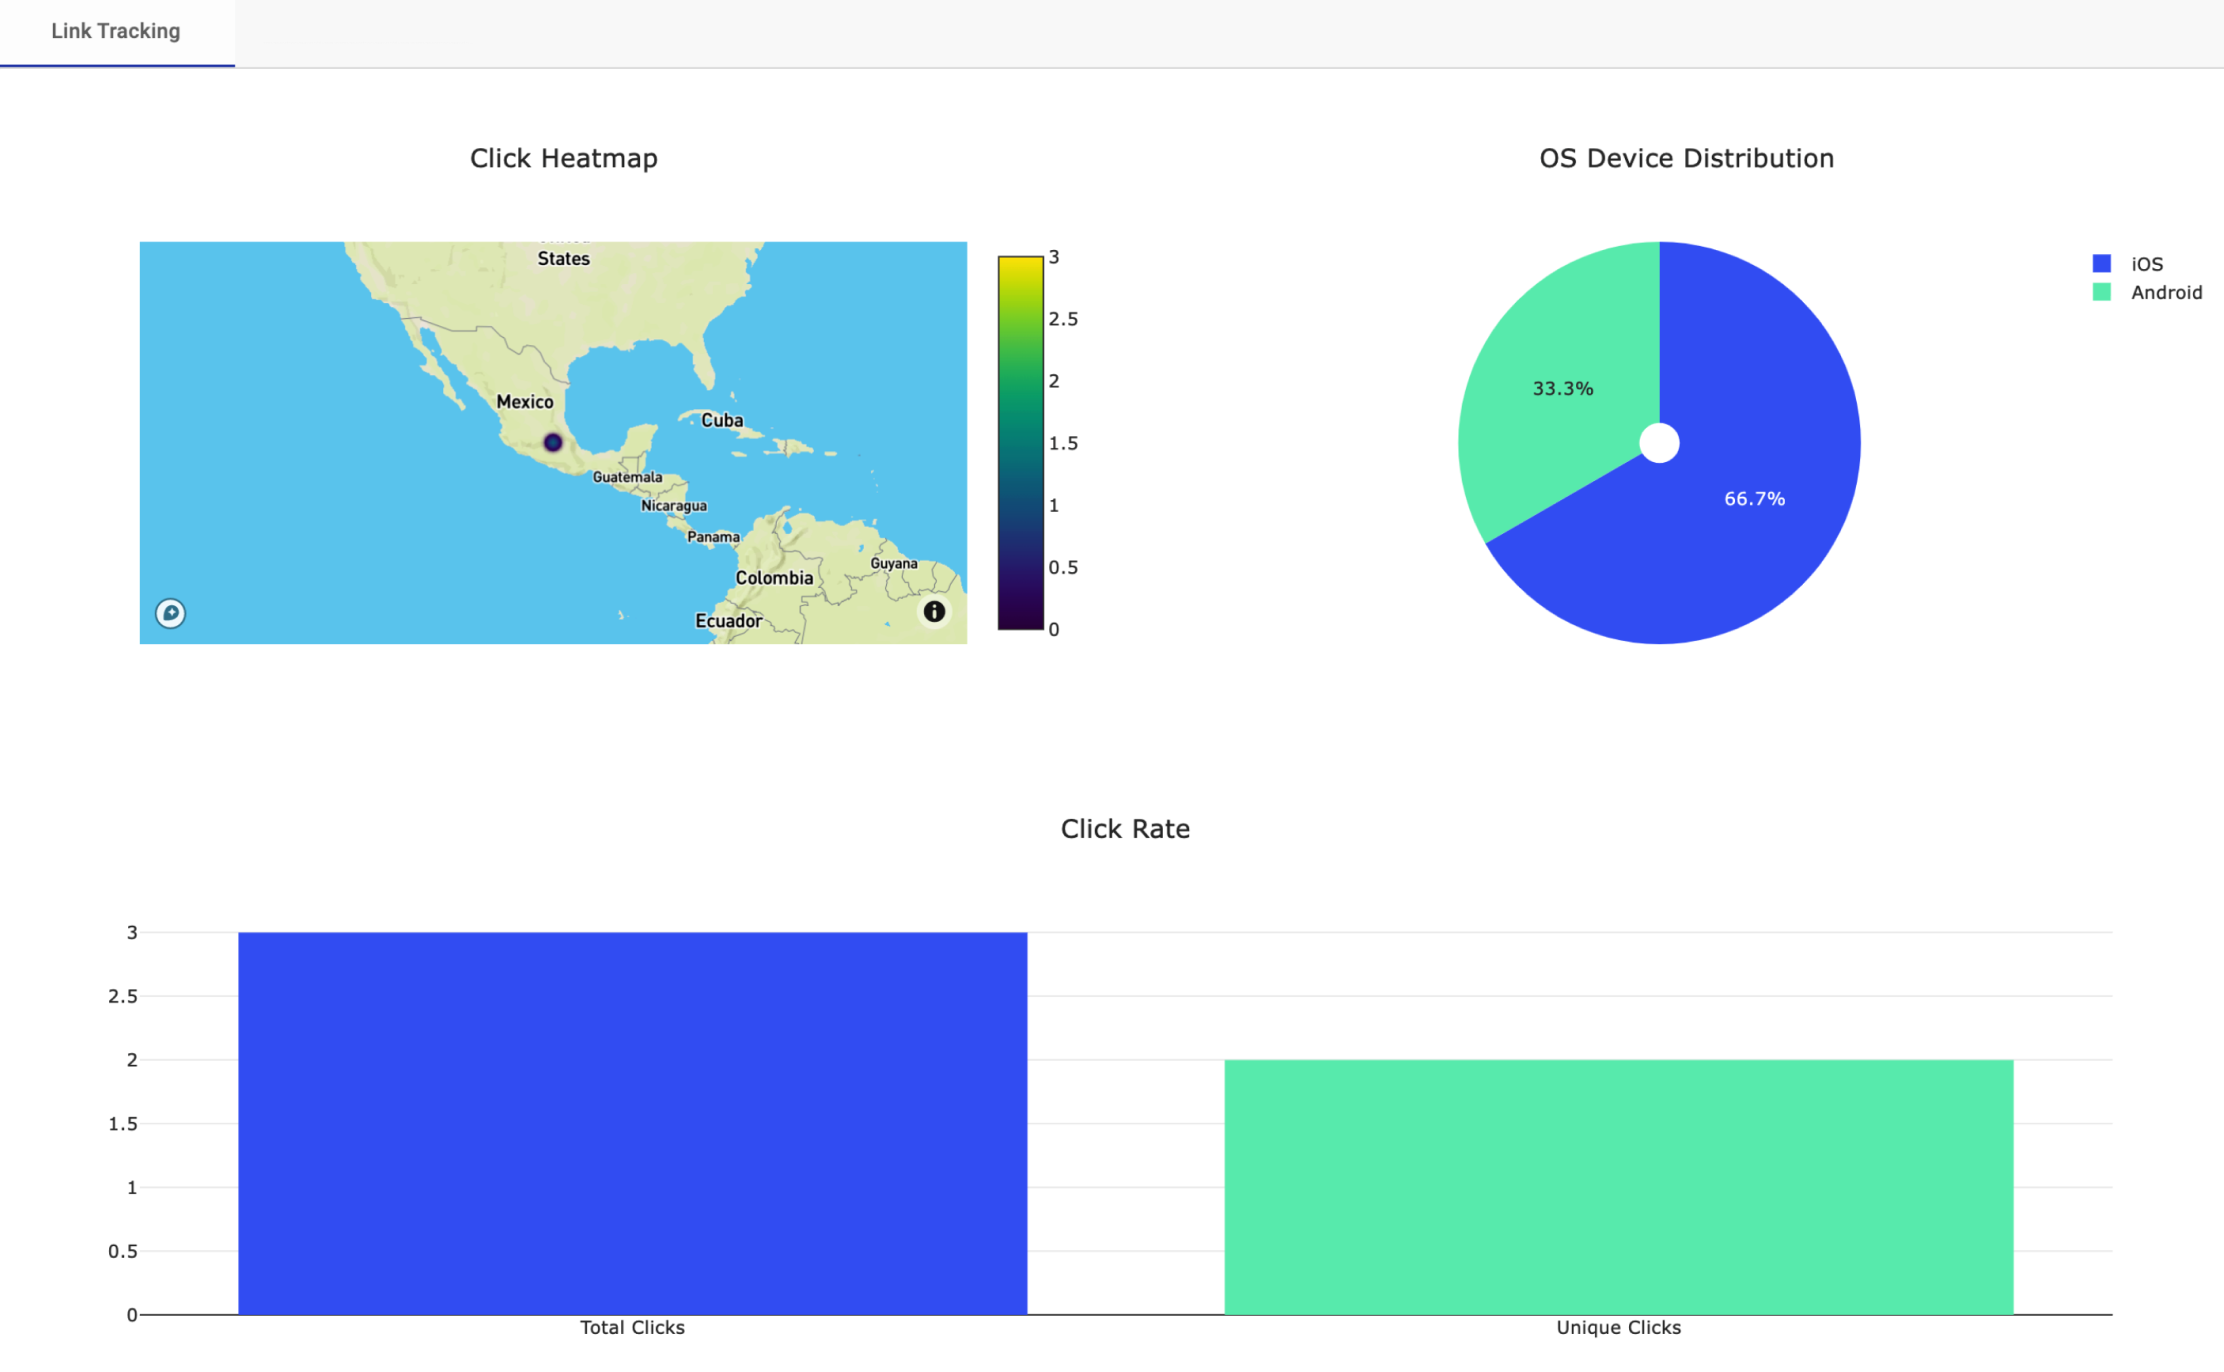
-
Click Heatmap: Determines the geographical distribution of the user once the user clicks on the link (ShortURL) of the campaign.
-
OS Device Distribution: Pie chart showing which operating systems recipients used to open the campaign.
-
Click Rate: Total number of general and unique clicks when the end user clicks on the link (ShortURL) of the campaign.
The chart displays the following two bars:
-
Total Opens: Total number of general clicks when the end user clicks on the ShortURL and is redirected to answer the trivia.
-
Unique Opens: Total number of unique clicks when the end user clicks on the ShortURL and is redirected to answer the trivia.
-
Interaction Events tab
Distribution and detail for each event associated with the campaign and carried out by the end users and registered by date. That is, this report will count the number of interactions for each event per day.
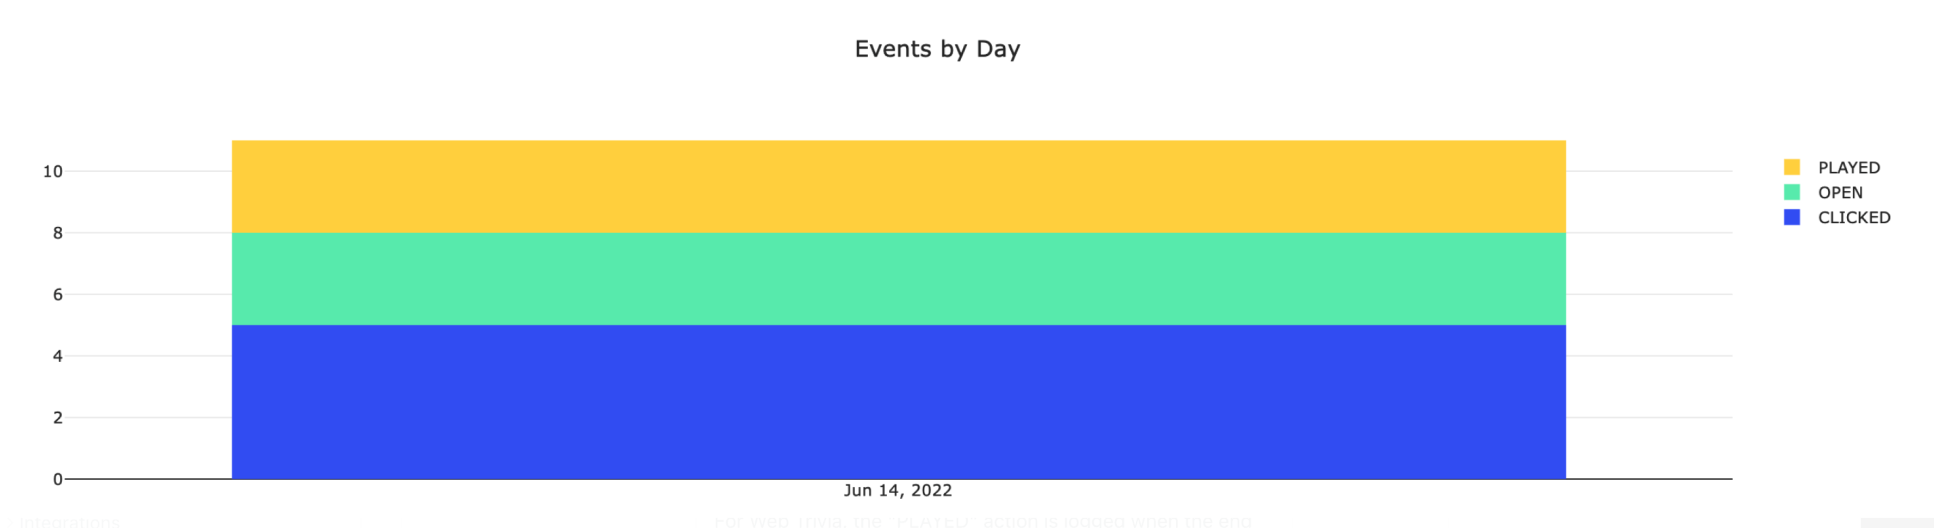
- PLAYED: Total number of unique played interactions carried out by end users in the interactive campaign.
For Web Trivia, the "PLAYED" action is logged when the end user has clicked on the Start button to begin the Trivia.
-
OPEN: Total number of clicks that the ShortURL of the interactive campaign has received from the end users.
-
CLICKED: Total number of general clicks when the end user has clicked on the Loser Screen.
-
CLAIM: End user claims the prize if it exists. The end user has clicked on the Claim Now button to claim the prize.
-
ASSIGNED: Total number of assigned prizes to the end users.
-
EXPIRED: The campaign has expired.
Updated 3 months ago