SMPP Traffic (Analytics & Reporting)
Once SMPP connectivity is active and messages are being submitted, all traffic is processed through the same centralized messaging infrastructure that powers the Communications Platform. That is, it does not create a separate processing environment. Instead, it acts as a transport layer that feeds traffic into the platform’s core messaging engine.
When a client is granted access to a Workspace, they will receive an email notification with instructions to register. After completing registration and logging in, they can access the Communications Platform.
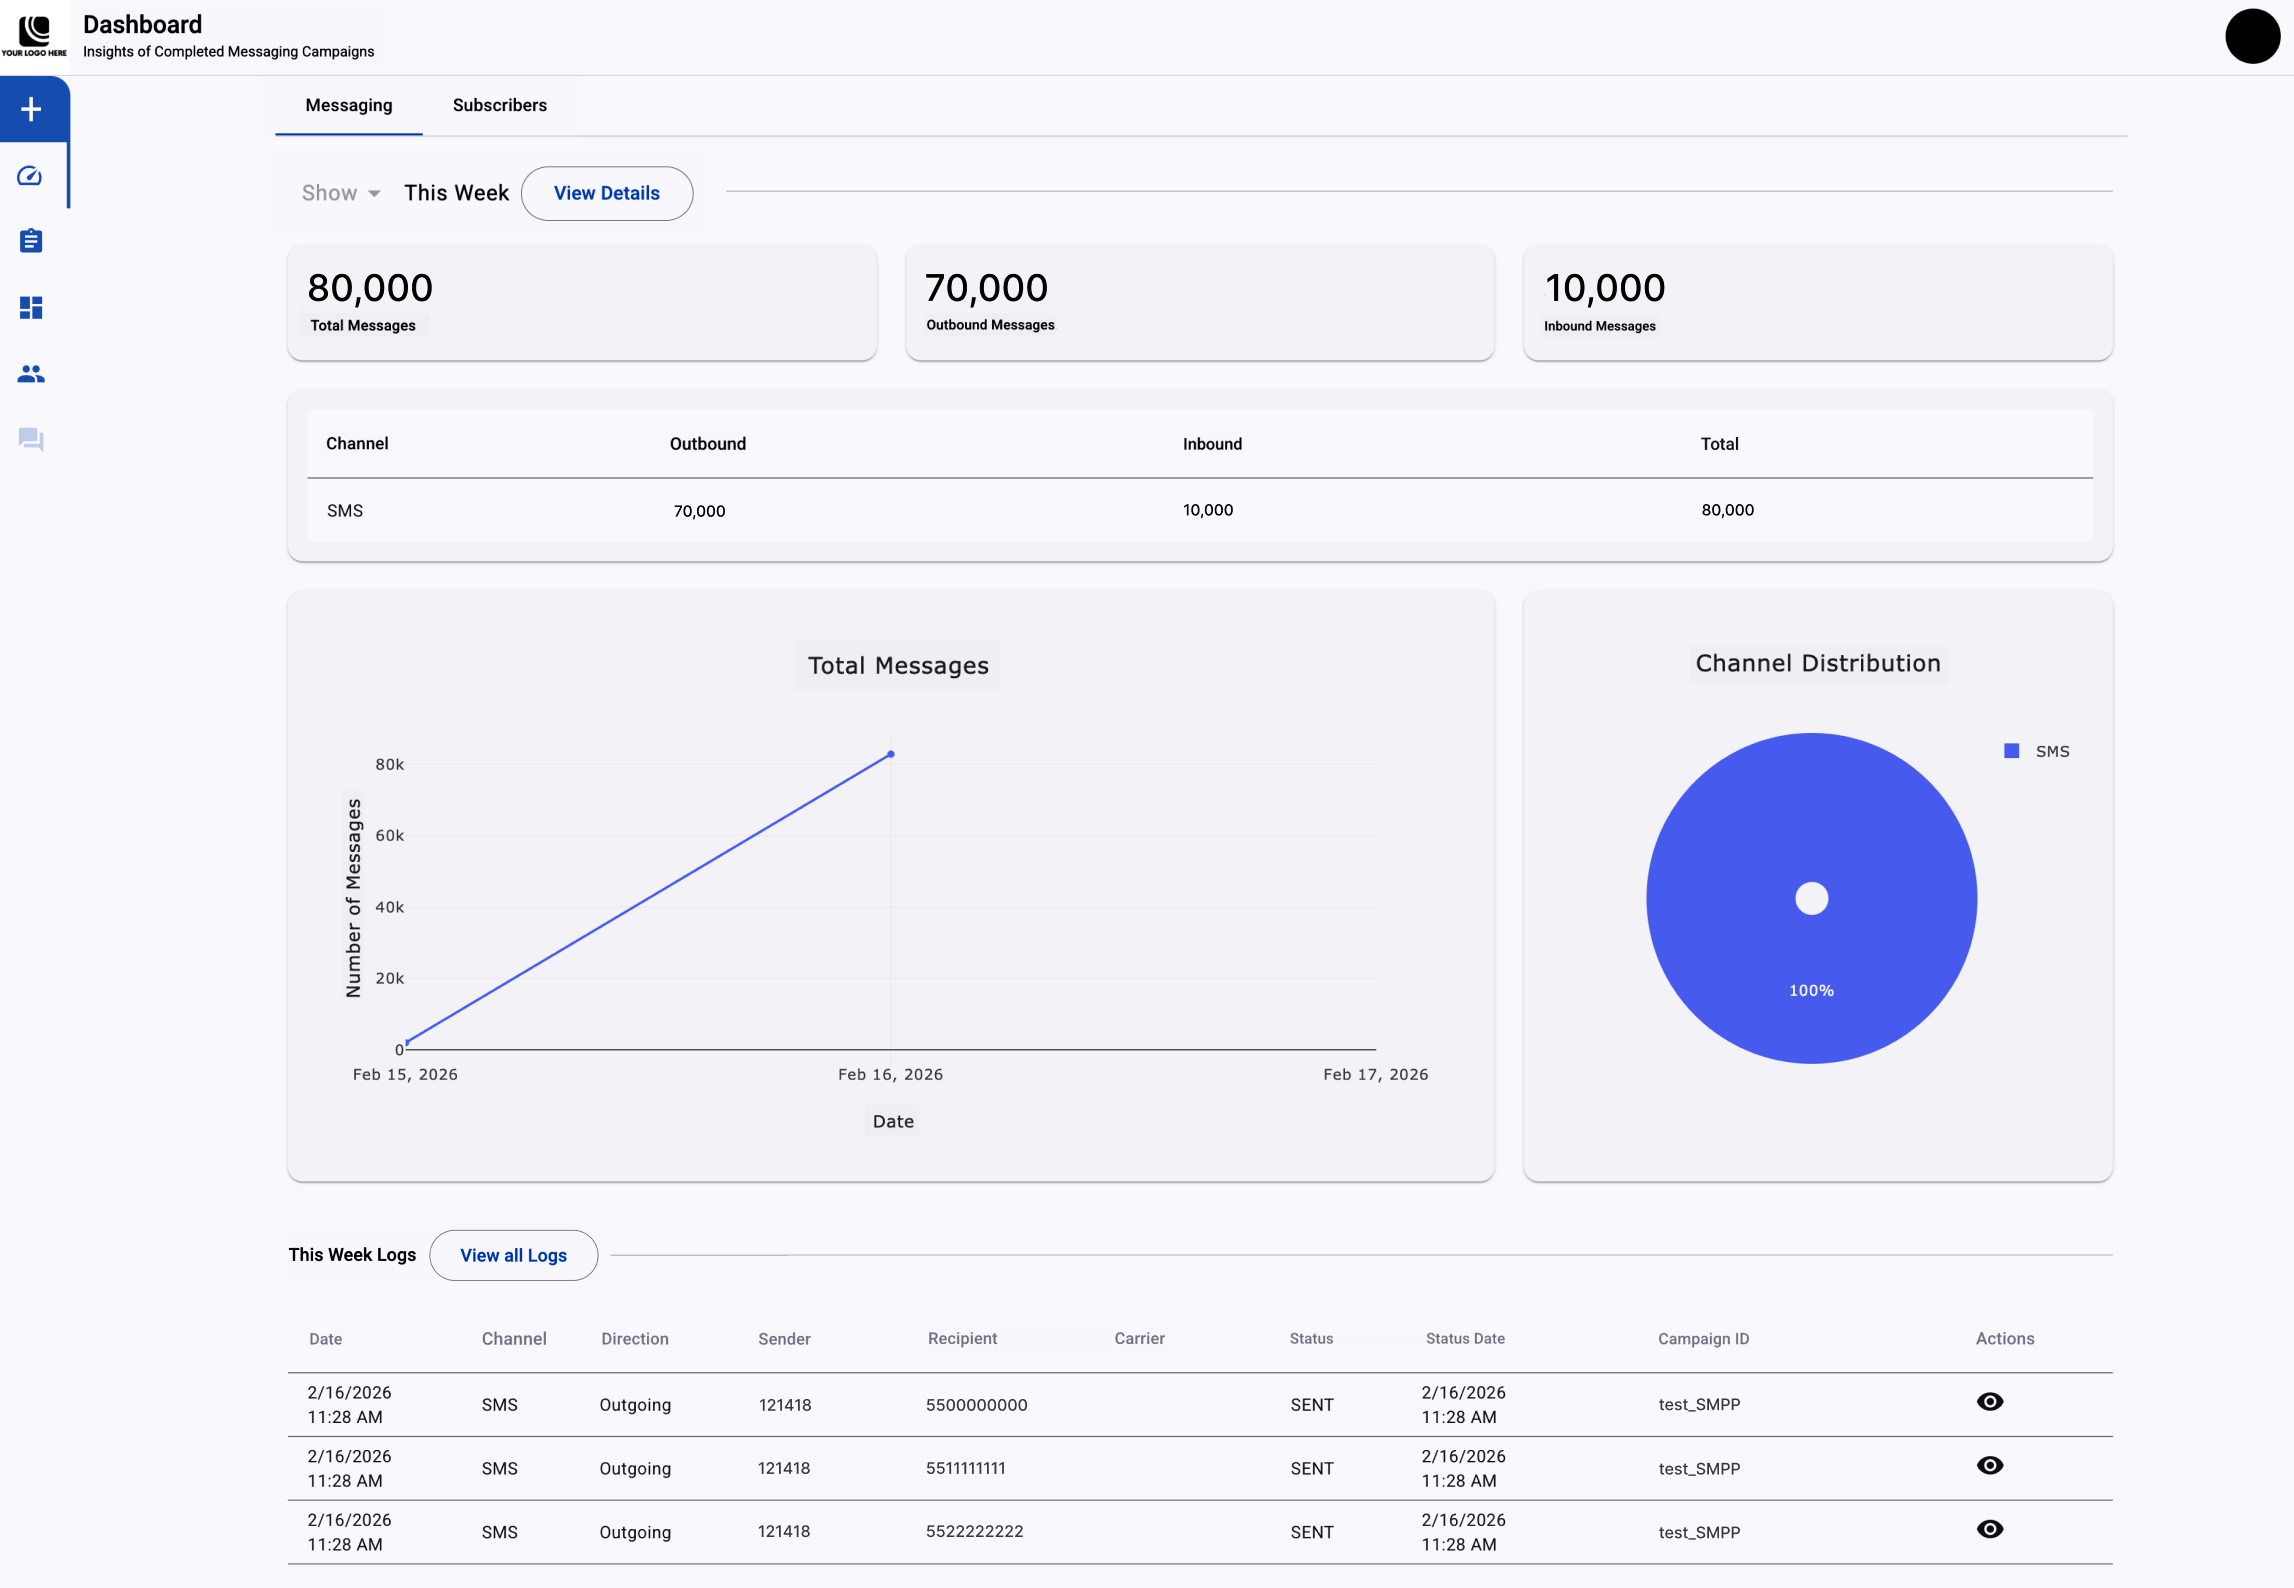
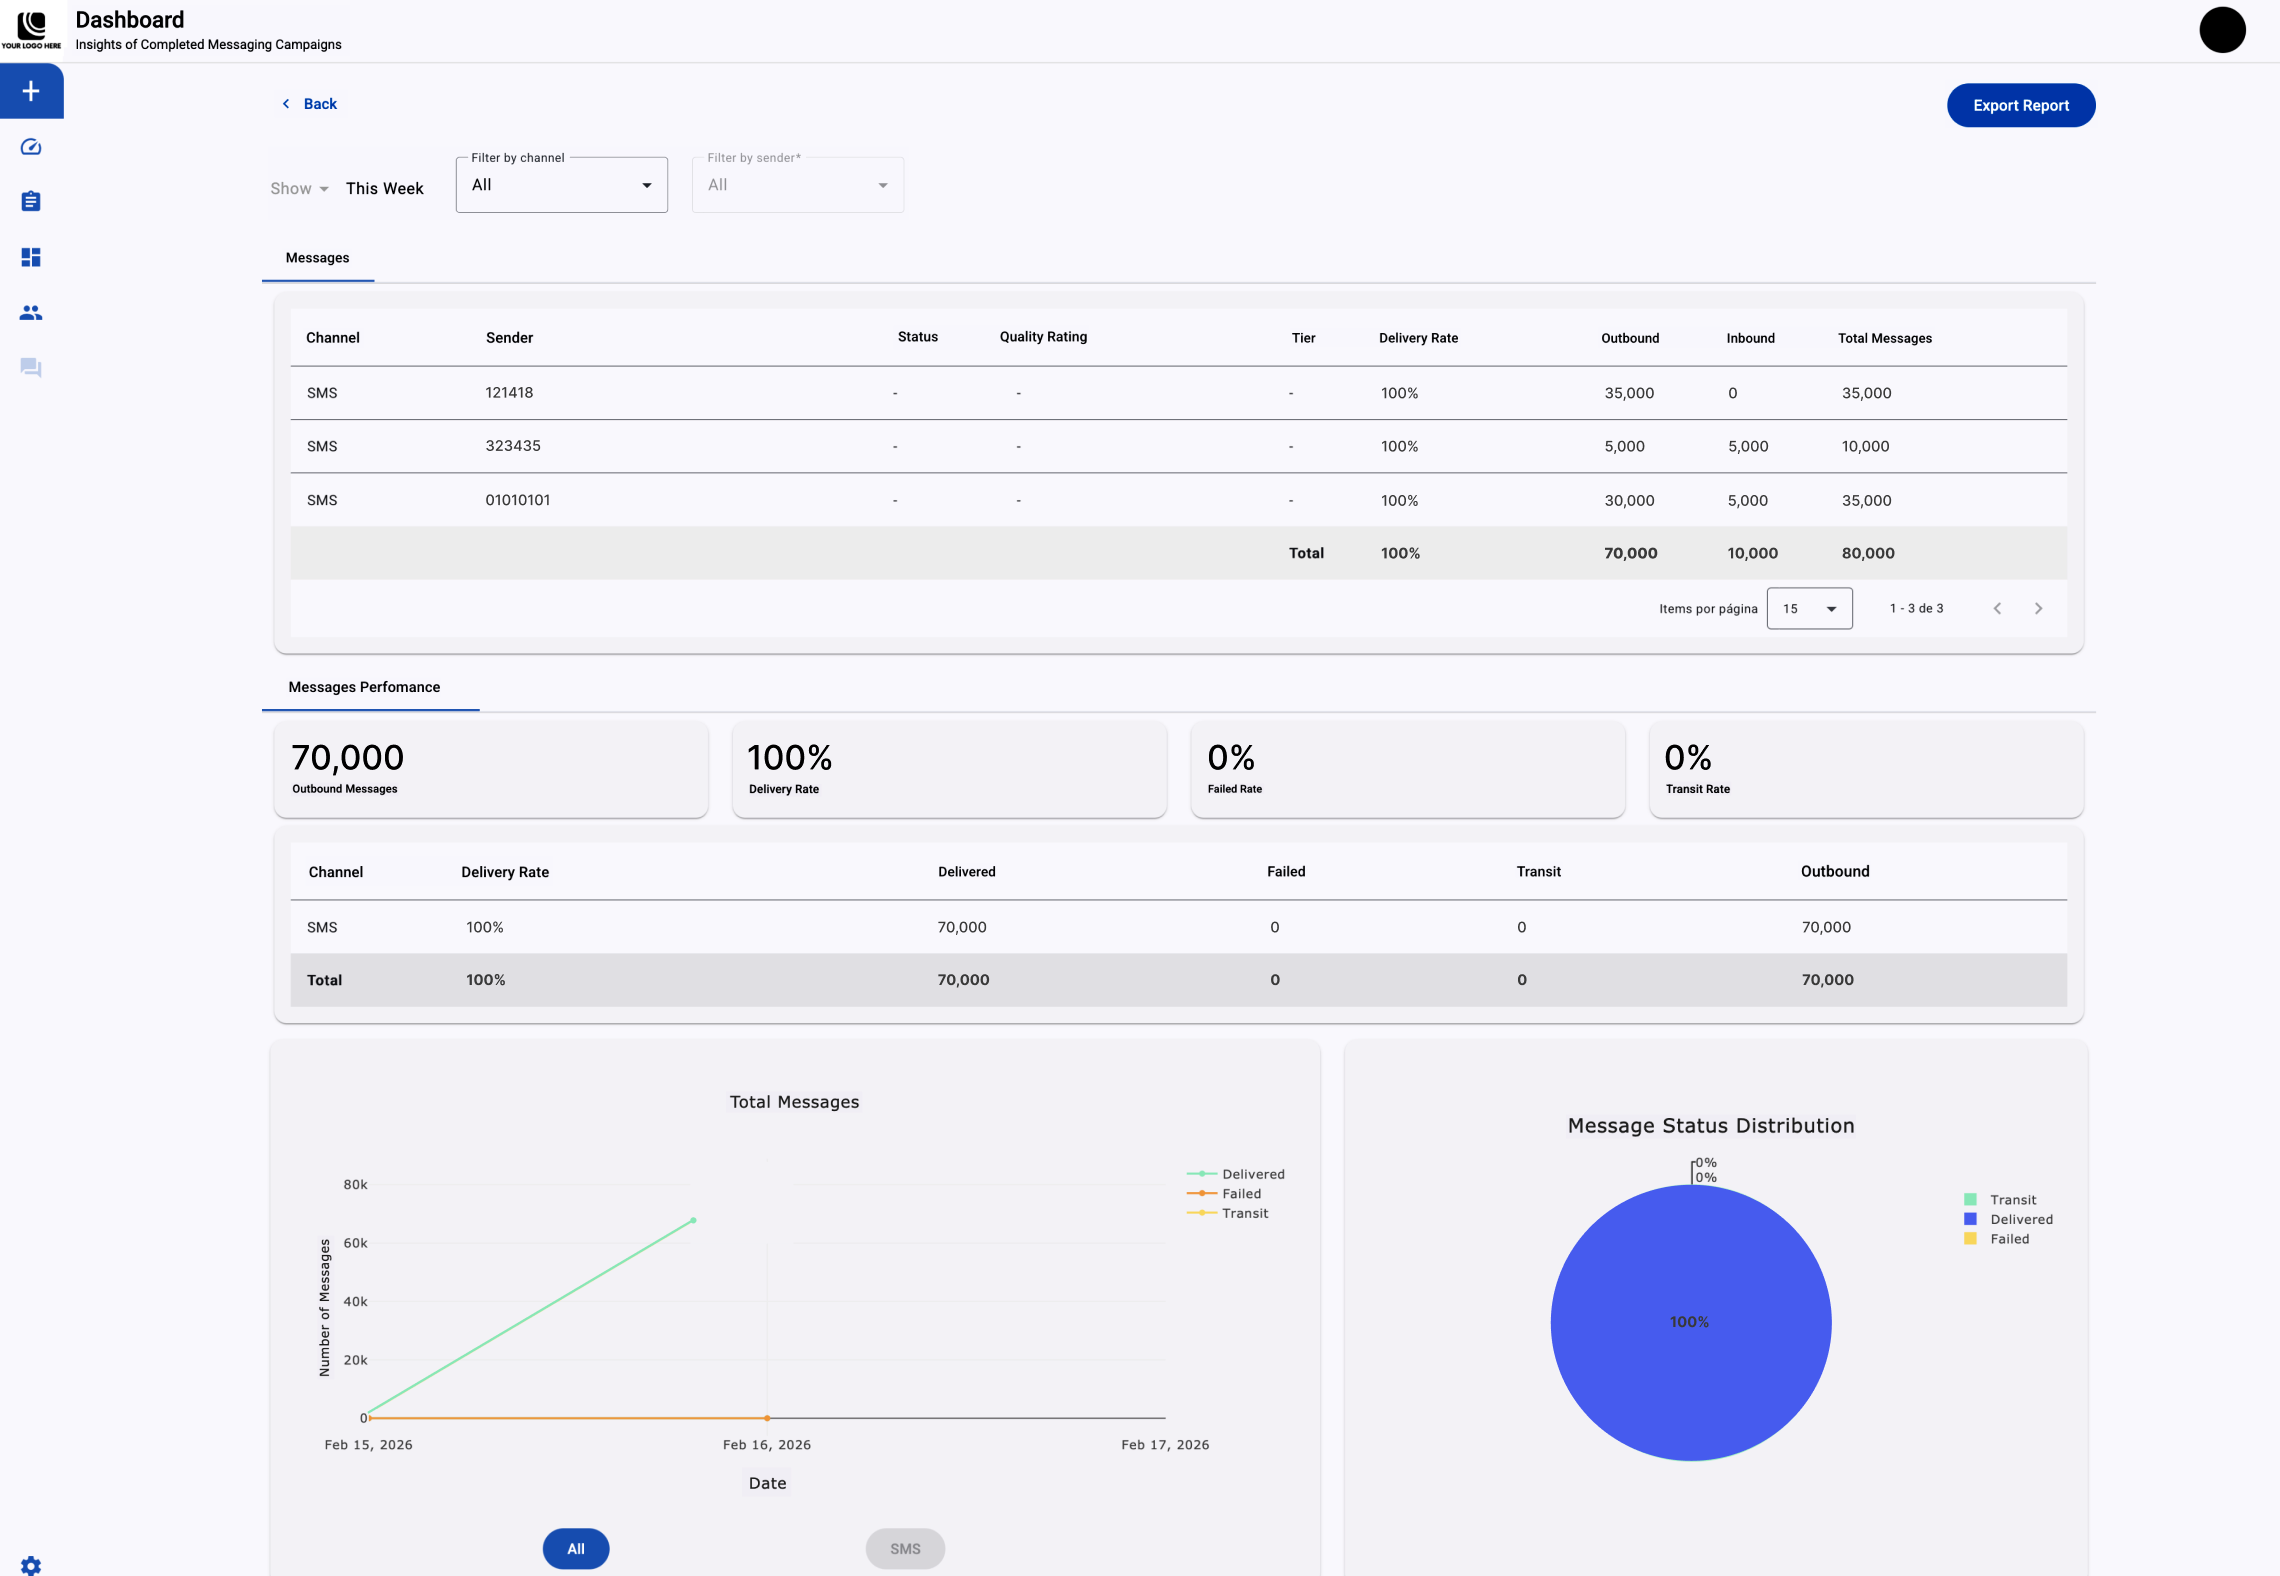
The Dashboard is the first screen you see when you log into the Communications Platform. It serves as the central hub for accessing and monitoring key metrics related to your SMS traffic.
The Messaging Tab provides detailed insight into all bidirectional messaging activity and delivery performance metrics across SMS broadcast. This section is ideal for tracking message exchange volumes, delivery success, and sender performance.
Date range Filter
The Date Range Filter allows you to narrow your data by selecting a date range. This filter ensures that you only view data generated during a specific period.
To use it:
-
Click the Show dropdown at the top right of the tab.

-
Choose from predefined ranges such as Today, Yesterday, This Week, This Month, Last Month, This Quarter, Last Two Weeks, or Custom range. For custom dates, select the start and end dates from the calendar and click OKAY.
The filter will automatically refresh the displayed data based on your selected timeframe.

NOTEWhen selecting the "This Week" option, the date range filter could consider Sunday as the first day of the week, depending on the browser's timezone.
KPIs
The KPI Snapshots correspond to the period defined in the Show Date Range Filter, and they represent totals for that period exclusively.

- Total Messages: Represents the total number of SMS messages processed within the selected period. This includes all outbound and inbound SMS traffic associated with the configured SMPP connection.
- Outbound Messages: Total number of SMS messages sent from the client’s system through the SMPP session to mobile network operators.
- Inbound Messages: Total number of SMS messages received from end users.
Messages Exchanged
The Messages Exchanged table provides a detailed breakdown of SMS traffic associated with the configured SMPP connection. Therefore, this table reflects the volume of SMS messages processed during the selected period and separates activity based on message direction.

The table includes the following columns:
- Channel: Identifies the SMS channel through which the SMPP traffic is processed.
- Outbound: Displays the total number of SMS messages submitted from the client’s system through the SMPP session and routed toward mobile network operators.
- Inbound: Displays the total number of SMS messages received from end users.
- Total: Represents the combined number of outbound and inbound SMS messages processed during the selected timeframe.
General Data Visualization
The Dashboard includes visual analytics components that allow users to monitor SMS traffic generated through the SMPP connection.
Below the Messages Exchanged table, two graphical representations provide a visual overview of traffic behavior within the selected date range.
-
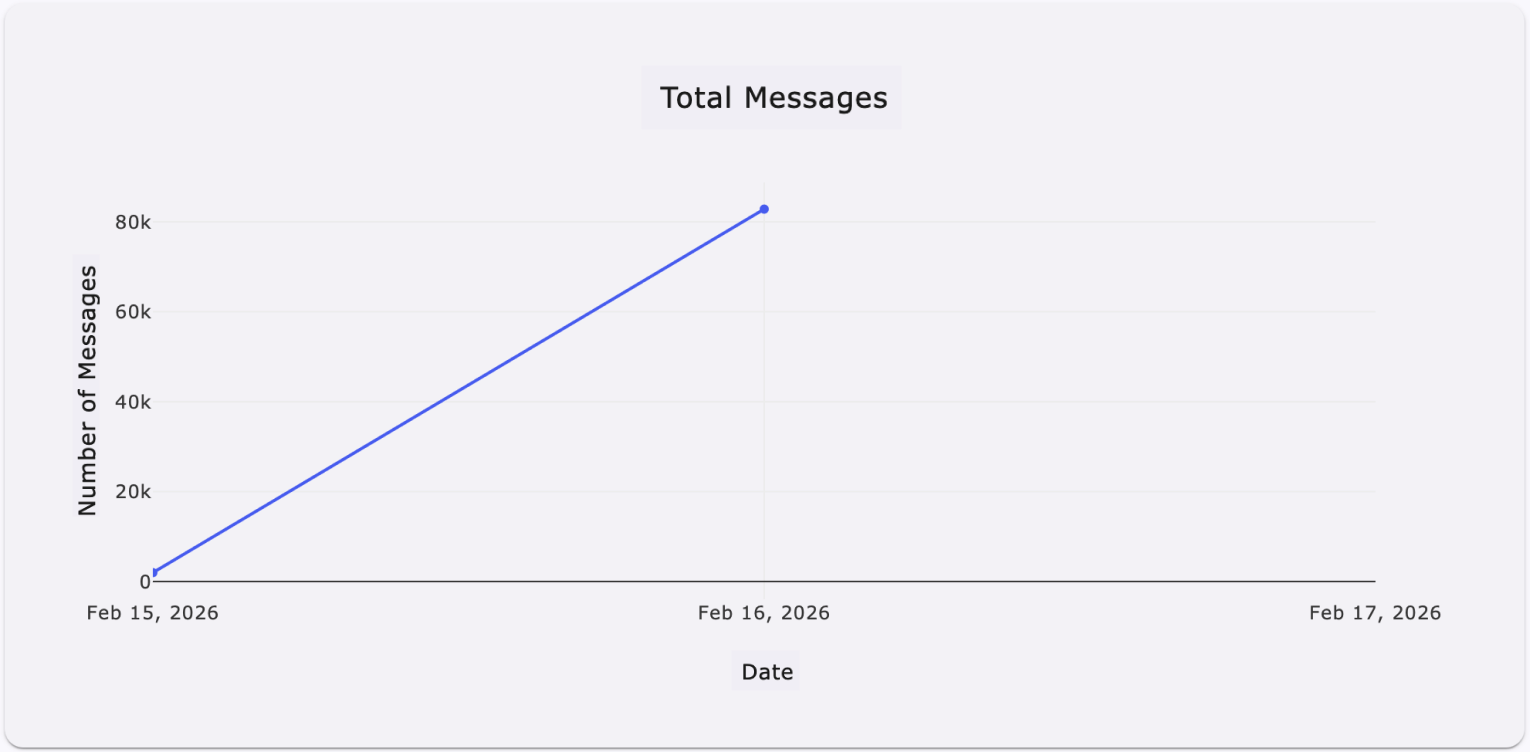
Total Messages Line Graph: This line graph shows SMS traffic over time for the selected date range. The horizontal axis represents the selected time period, while the vertical axis indicates the number of SMS messages processed on each date. The graph reflects outbound and inbound activity associated with the configured SMPP connection.
-
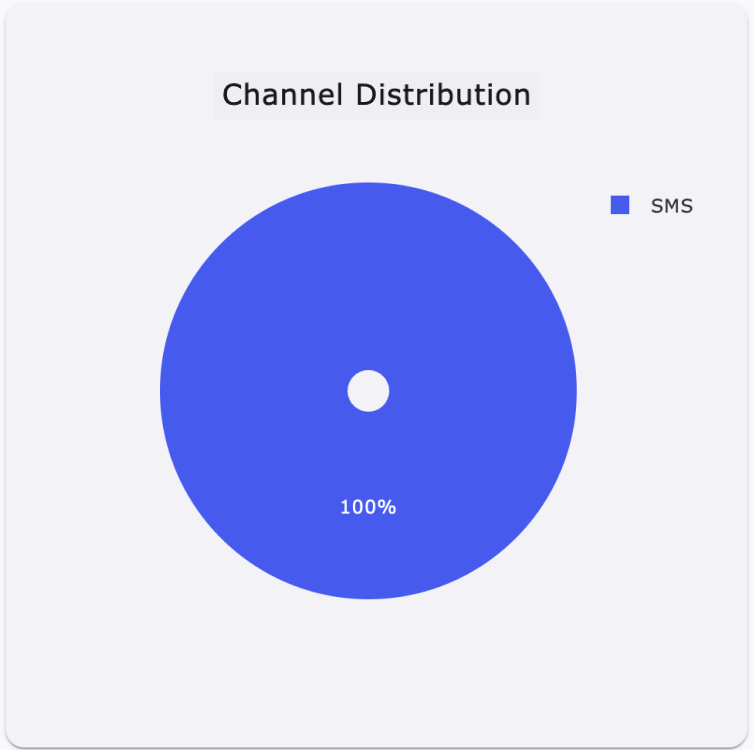
Channel Distribution Pie Chart: This pie chart displays the proportional distribution of SMS traffic within the selected date range.
Traffic by Sender
The Traffic by Sender view allows you to analyze SMS traffic grouped by sender identity configured for the SMPP connection. That is, this section enables you to evaluate message volume, delivery performance, and directional traffic (MT and MO) for each configured sender.
To access this view, click the View Details button next to the date range filter.
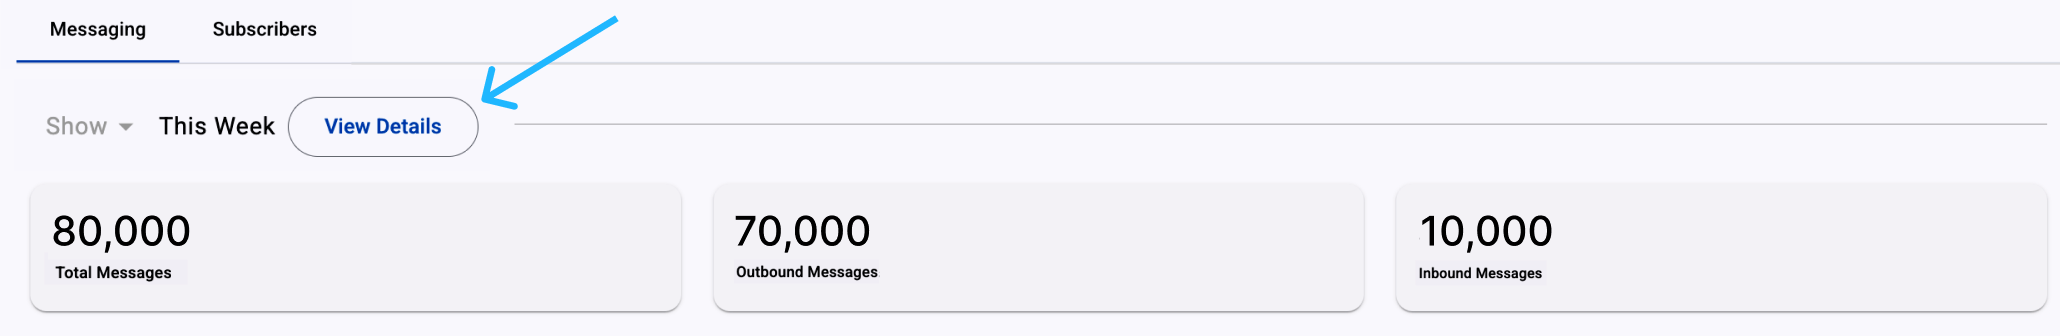
This section enables you to evaluate message volume, delivery performance, and directional traffic (MT and MO) for each configured sender between two tabs:
- Messages tab
- Messages Performance tab
Messages Tab
The Messages tab displays a table summarizing the number of messages sent (MT), received (MO), and delivery rates per sender. Aditionally, this table includes information on the success rate of delivered messages for each sender.
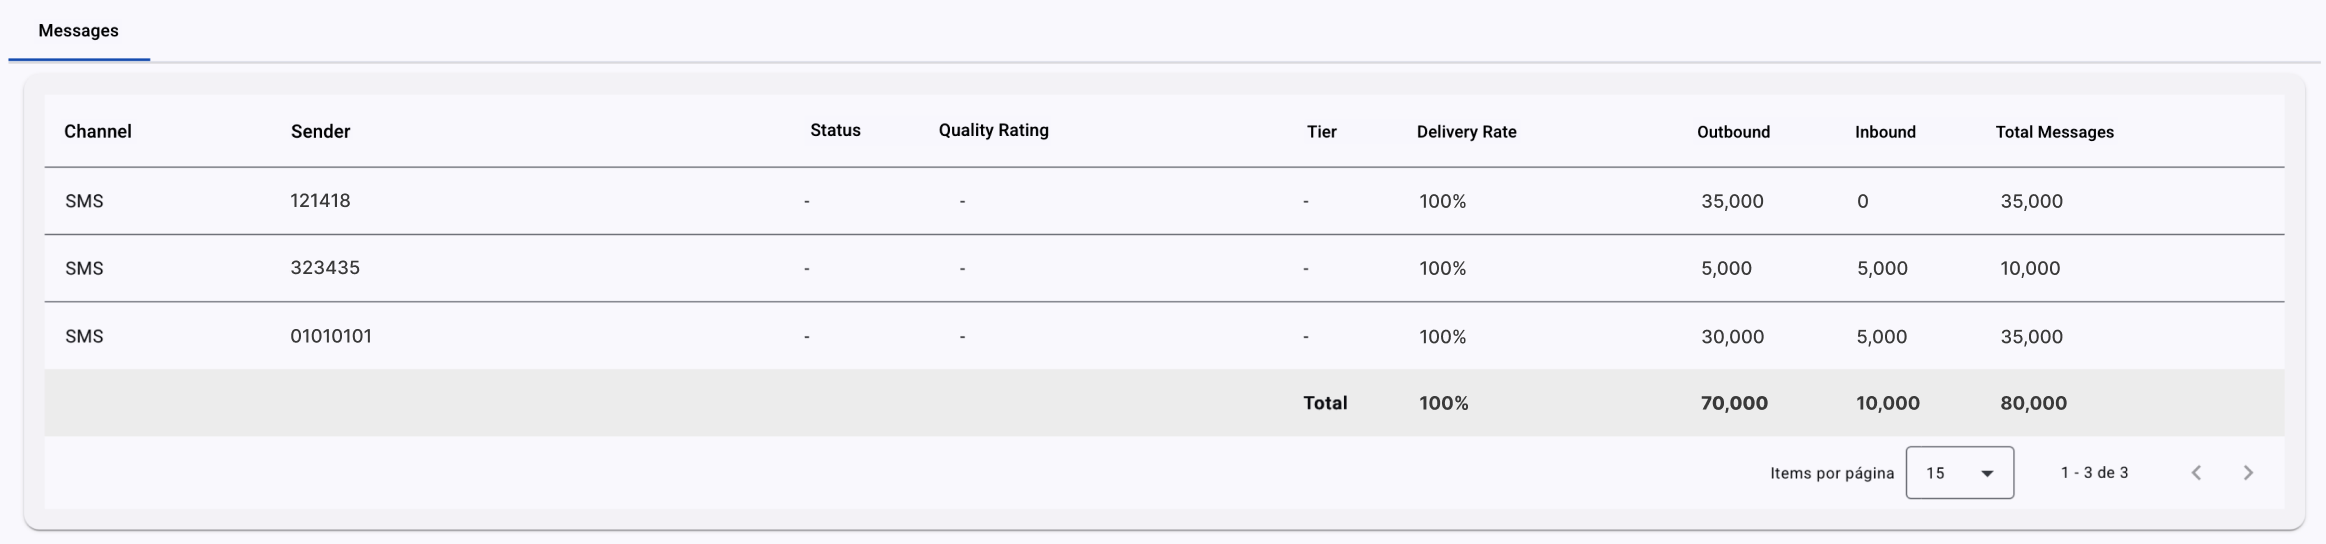
The table includes the following columns:
- Channel: Identifies the SMS channel associated with the sender.
- Sender: The configured SMS sending identity (e.g., short code, long code, or alphanumeric sender ID).
- Delivery Rate: Percentage of outbound SMS messages successfully delivered to end users.
- Outbound: Total number of SMS messages submitted from the client system through the SMPP connection using the respective sender.
- Inbound: Total number of SMS messages received from end users.
- Total Messages: Combined number of outbound and inbound SMS messages associated with the sender during the selected period.
Messages Performance Tab
The Messages Performance tab provides a detailed visualization and analysis of message delivery outcomes across SMS. It helps you monitor performance metrics, identify delivery issues, and evaluate overall messaging effectiveness.
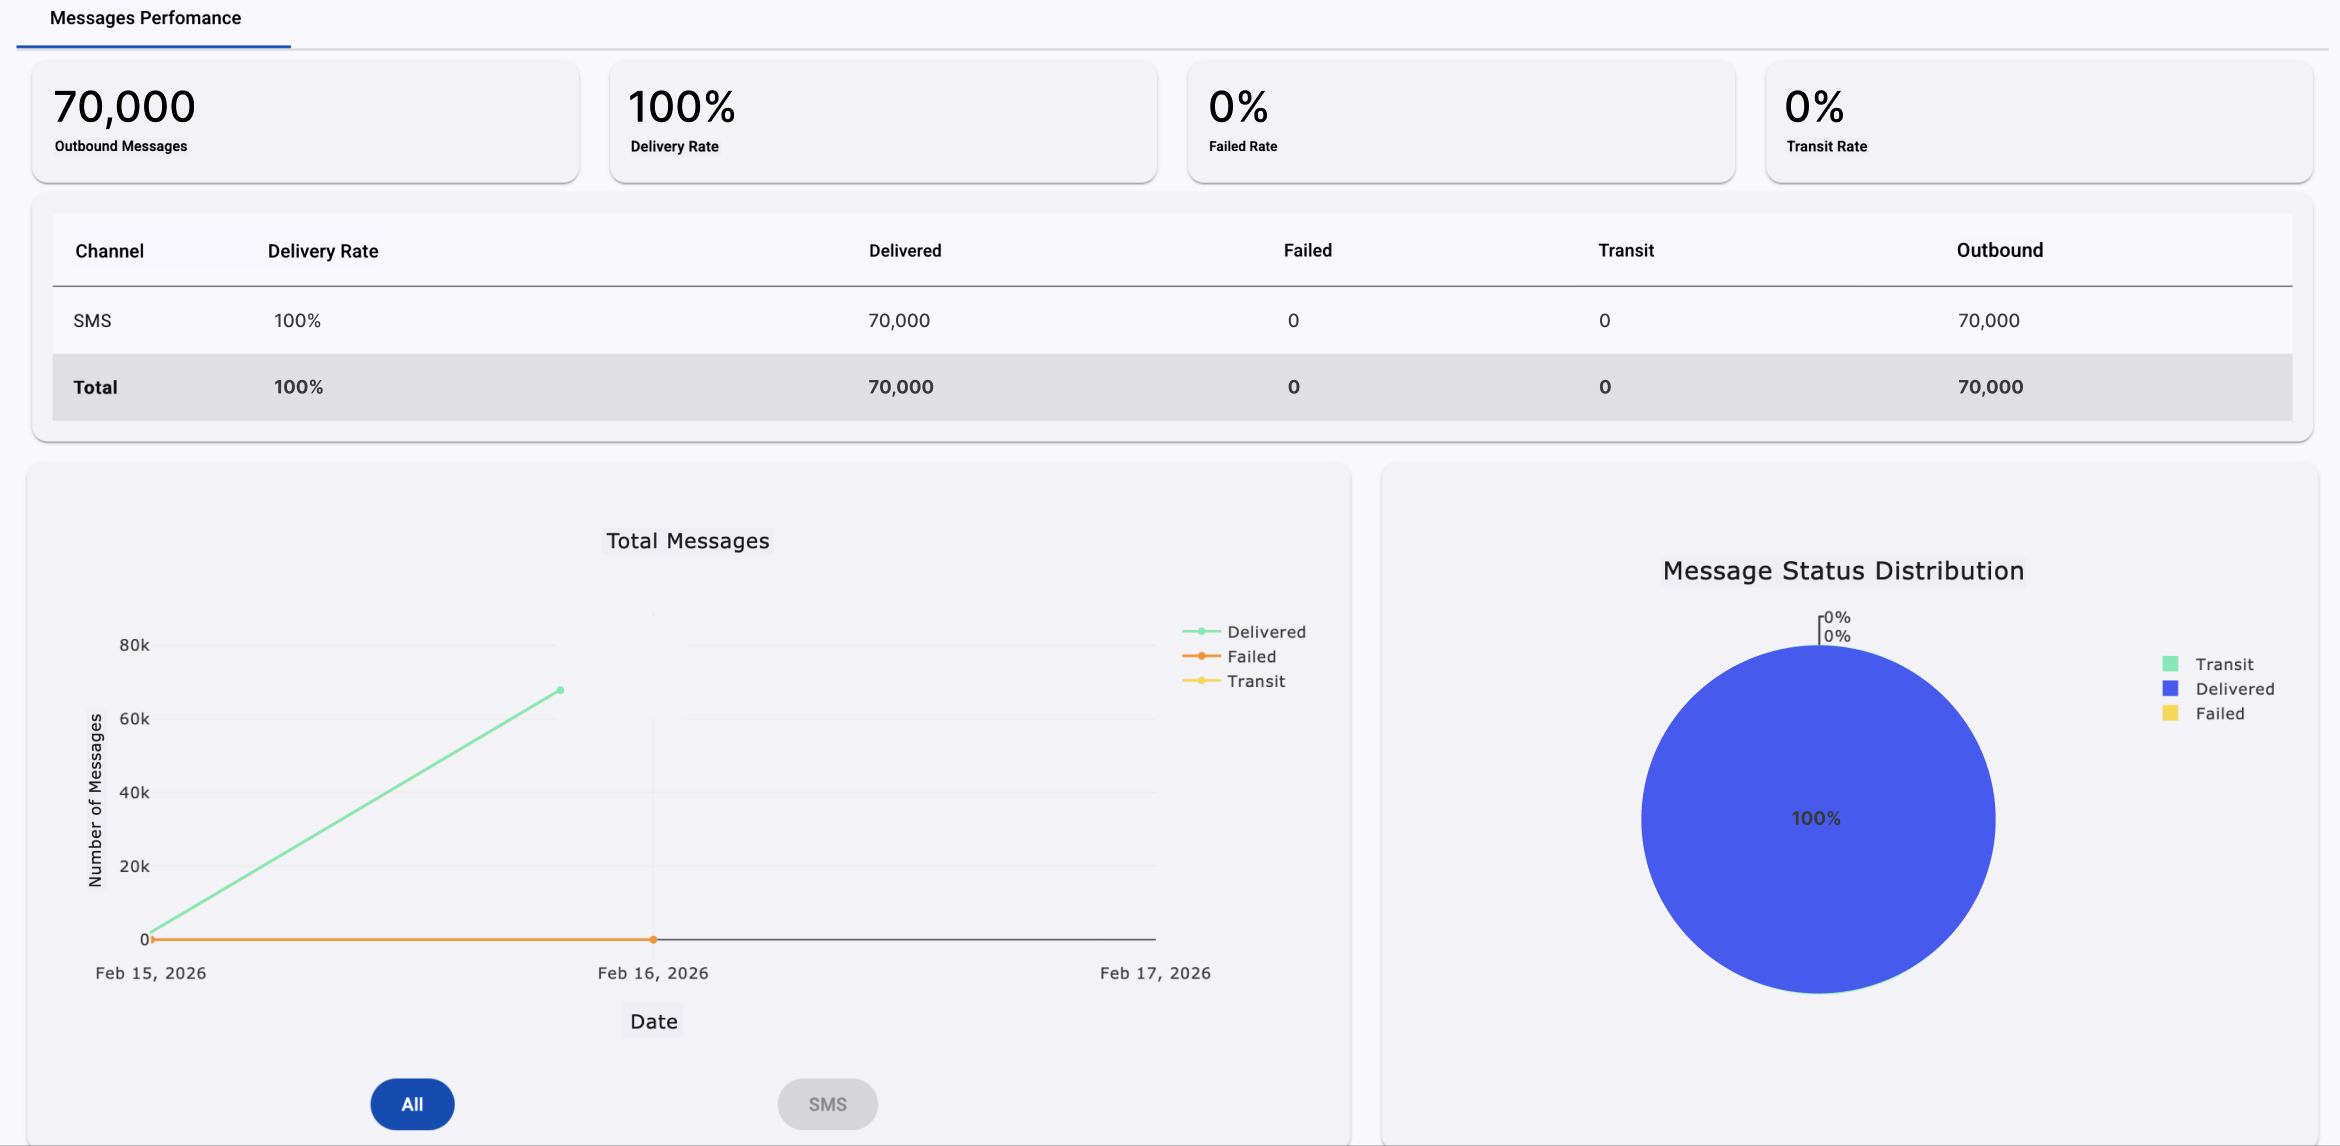
This section includes three main components:
-
The KPIs located at the top of the Messages Performance tab are the following:
- Outbound Messages: Total number of SMS messages submitted from the client system through the SMPP connection
- Delivery Rate: Percentage of outbound SMS messages successfully delivered to end users.
- Failed Rate: Percentage of messages that failed before reaching the recipient.
- Transit Rate: Percentage of SMS messages that are pending a final delivery status at the time of reporting.
-
The Performance Table provides a breakdown of delivery metrics for SMS traffic. It includes:
- Channel: Identifies the SMS channel associated with the sender.
- Delivery Rate: Percentage of successfully delivered SMS messages.
- Delivered: Total messages that have been successfully delivered.
- Failed: Total number of SMS messages that did not reach the recipient.
- Transit: Total number of SMS messages awaiting final delivery confirmation.
- Outbound: Total number of SMS messages submitted via SMPP.
-
Below the performance table, two graphs provide visual insight into messaging activity and performance:
- Total Messages by Status Chart displays the number of outbound, delivered, in-transit, and failed SMS messages across the selected date range. The horizontal axis represents the selected time period, while the vertical axis reflects message volume per status.
- Message Status Distribution Pie Chart illustrates the proportional distribution of SMS messages based on their final status: Delivered, Transit, or Failed.
After applying the desired filters, click Export Report to generate a downloadable file of the current results. Once confirmed, a .csv report will be sent to the email address associated with your session.
Messaging Logs
At the bottom of the Messaging tab, a table displays the detailed log of SMS messages processed within the selected date range. This table reflects SMS traffic associated with the configured SMPP connection and presents message records in reverse chronological order, from newest to oldest.
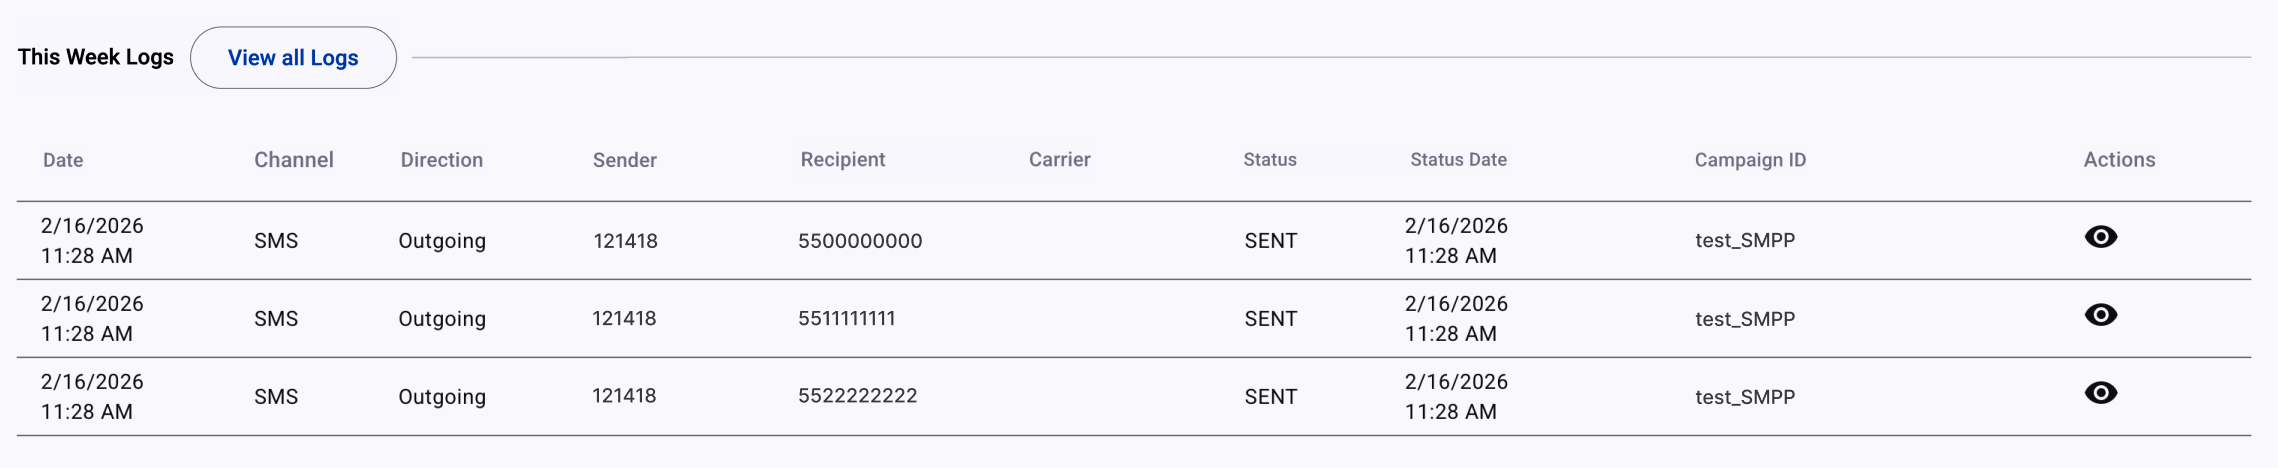
Each row represents a single SMS transaction and includes the following fields:
- Date: Date and time when the SMS was submitted or received.
- Channel: Indicates the SMS channel.
- Direction: Identifies whether the message was outbound (MT) or inbound (MO).
- Sender: Displays the SMS sending identity used in the exchange, such as a short code, long code, or alphanumeric sender ID.
- Recipient: Mobile number that received the outbound message or originated the inbound message.
- Carrier: Displays the recipient’s mobile network operator for outbound SMS messages, when available. Carrier information may not always be immediately visible depending on delivery status processing.
- Status: Represents the current delivery state of the message. For a complete description of each possible delivery status, refer to the SMS Status section.
- Status Date: Date and time when the current status was recorded.
- Campaign ID: Identifies the associated broadcast or the external identifier defined during message submission.
- Action: Allows you to open and review the complete details of the specific message record.
At the top of the table, it is located the View all Logs button, which takes you to a view of the Messaging log table that allows to modify its appearance in multiple ways to tailor it to your specific needs.
View all Logs
The View All Logs section provides an extended version of the Messaging Logs table, offering enhanced filtering and customization capabilities for SMS traffic associated with the configured SMPP connection. This view allows users to refine log results, isolate specific message records, and customize the table layout according to operational needs.
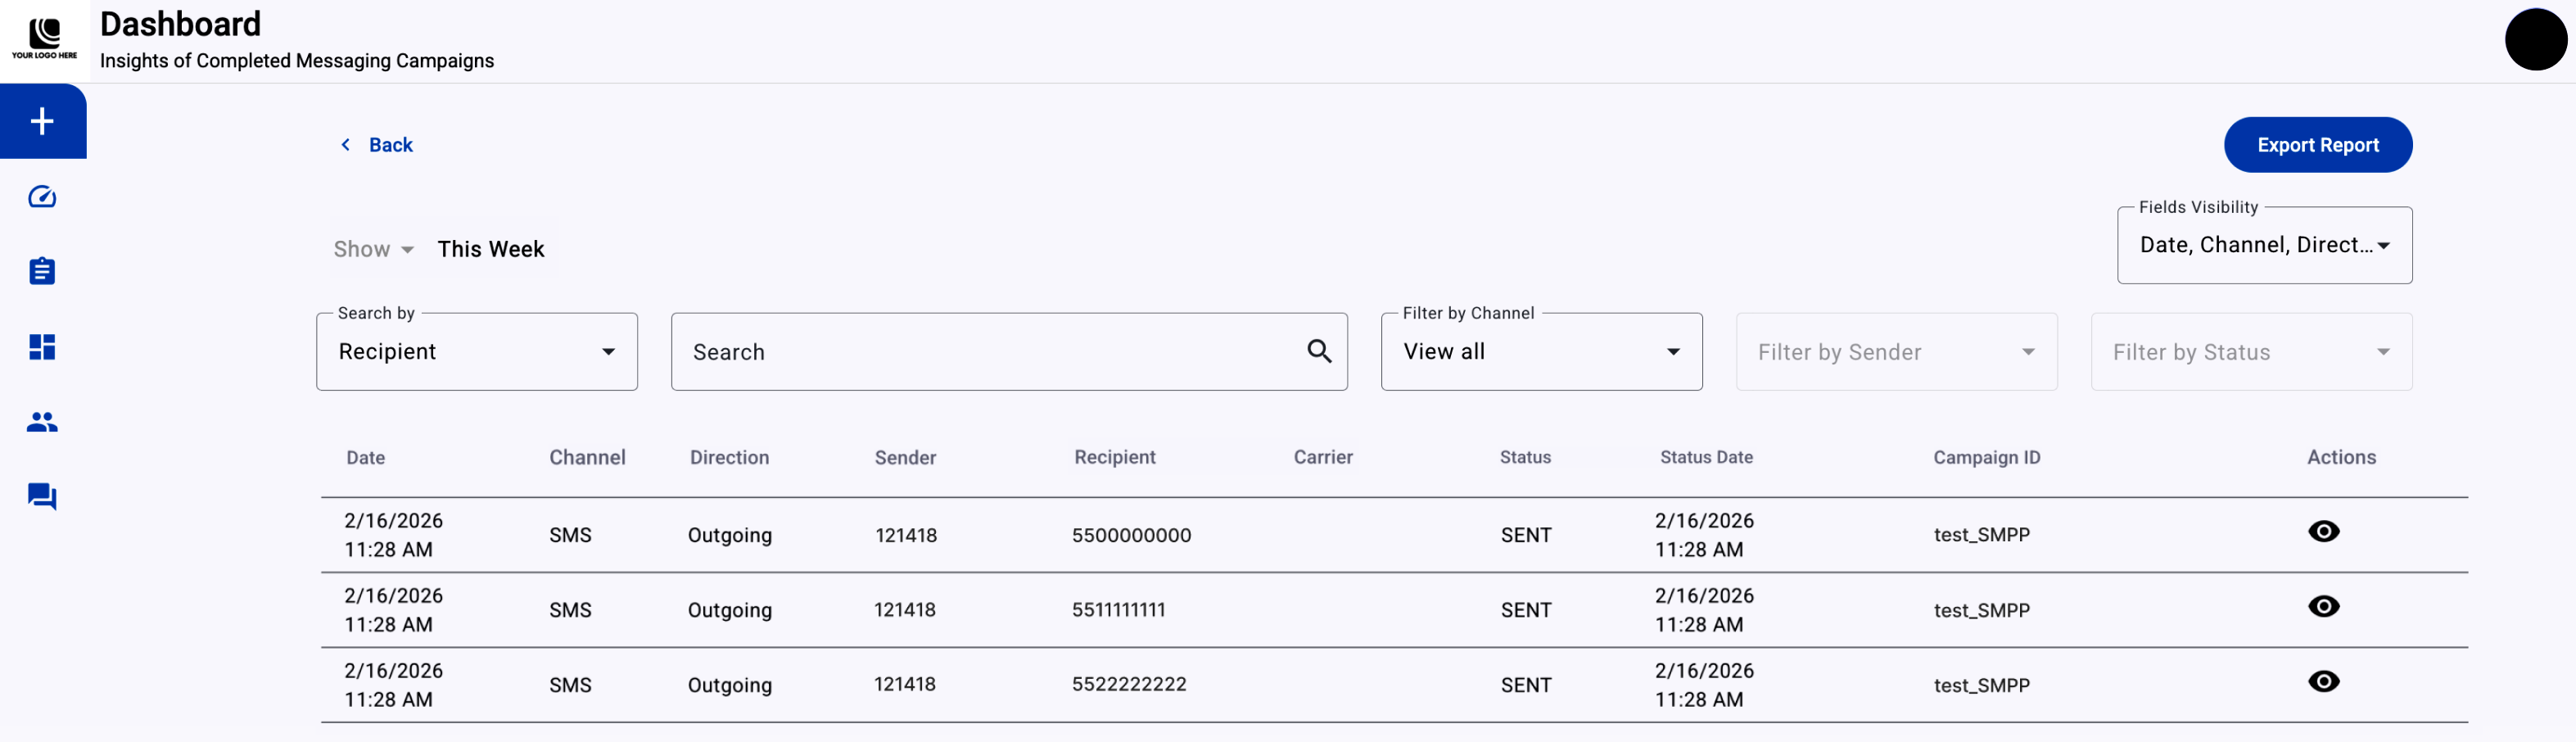
The following filtering and customization options are available:
- Date Range Filter: Displays only SMS records generated within the selected time period. The results are dynamically updated based on the chosen range. When using predefined options such as This Week, the start of the week may depend on the browser’s timezone settings.
- Search By: Allows users to define the search criteria. You may search by Recipient (mobile number) or by Campaign ID, depending on the selected option.
- Search Field: Enter the mobile number or Campaign ID associated with the message record you wish to locate.
- Filter by Channel: Allows filtering by SMS traffic.
- Filter by Sender: Displays logs associated with a specific SMS sender identity, such as a short code, long code, or alphanumeric sender ID.
- Filter by Status: Enables filtering of message records based on their delivery status . For detailed definitions of SMS delivery states, refer to the SMS Status section.
- Fields Visibility: Allows users to customize the table layout by selecting which columns are displayed. This feature helps tailor the view according to operational or reporting needs.
After applying the desired filters and column selections, click Export Report to generate a downloadable file of the current results. Once confirmed, a .csv report will be sent to the email address associated with your session.
Together, the Messaging Logs and View All Logs sections provide complete traceability of SMS traffic submitted through the SMPP connection. These tools enable detailed inspection, filtering, and performance analysis of each message, ensuring full operational transparency and efficient troubleshooting.
Updated 5 months ago